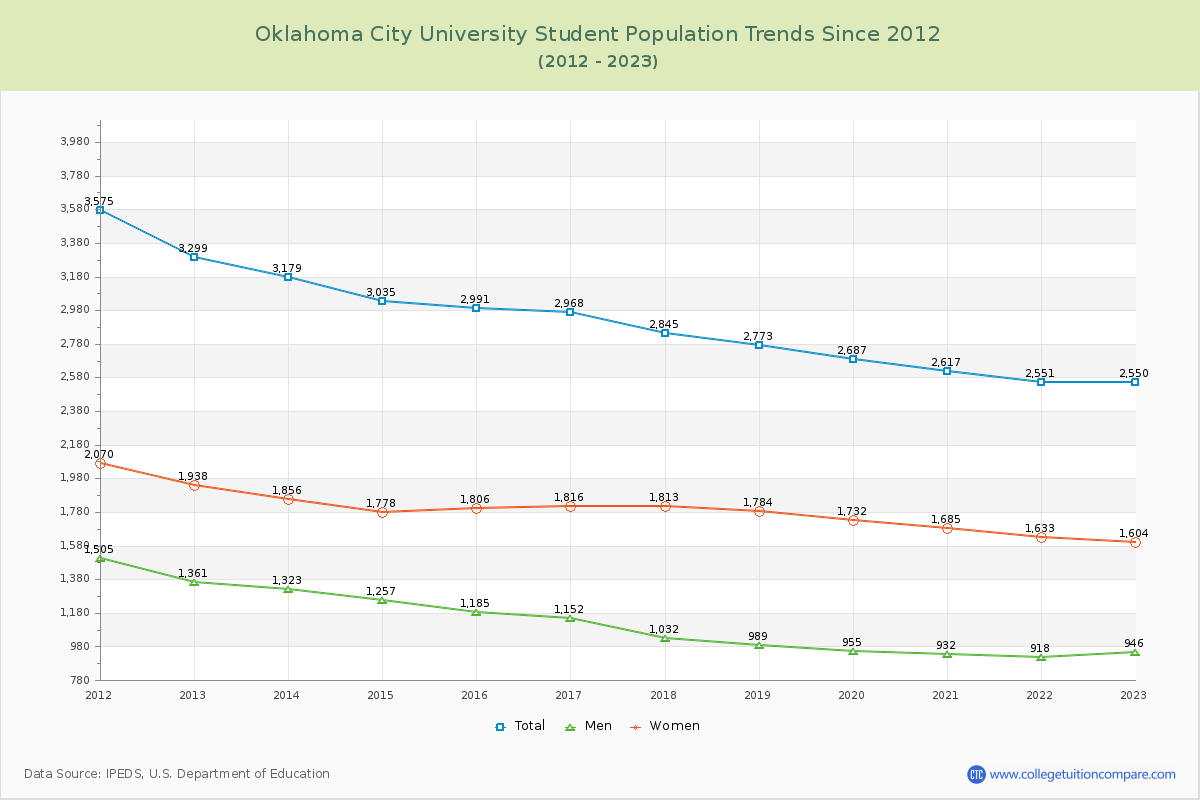
Student Population Changes
The average student population over the last 12 years is 2,863 where 2,550 students are attending the school for the academic year 2022-2023.
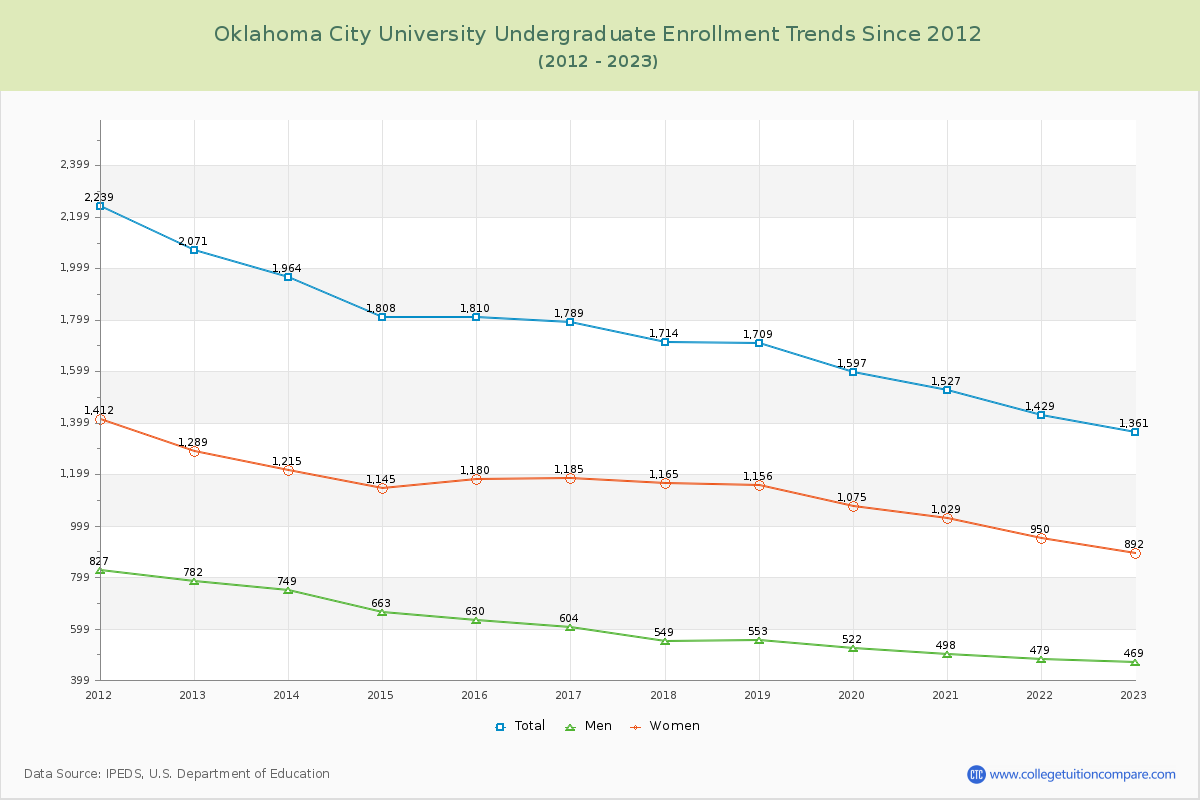
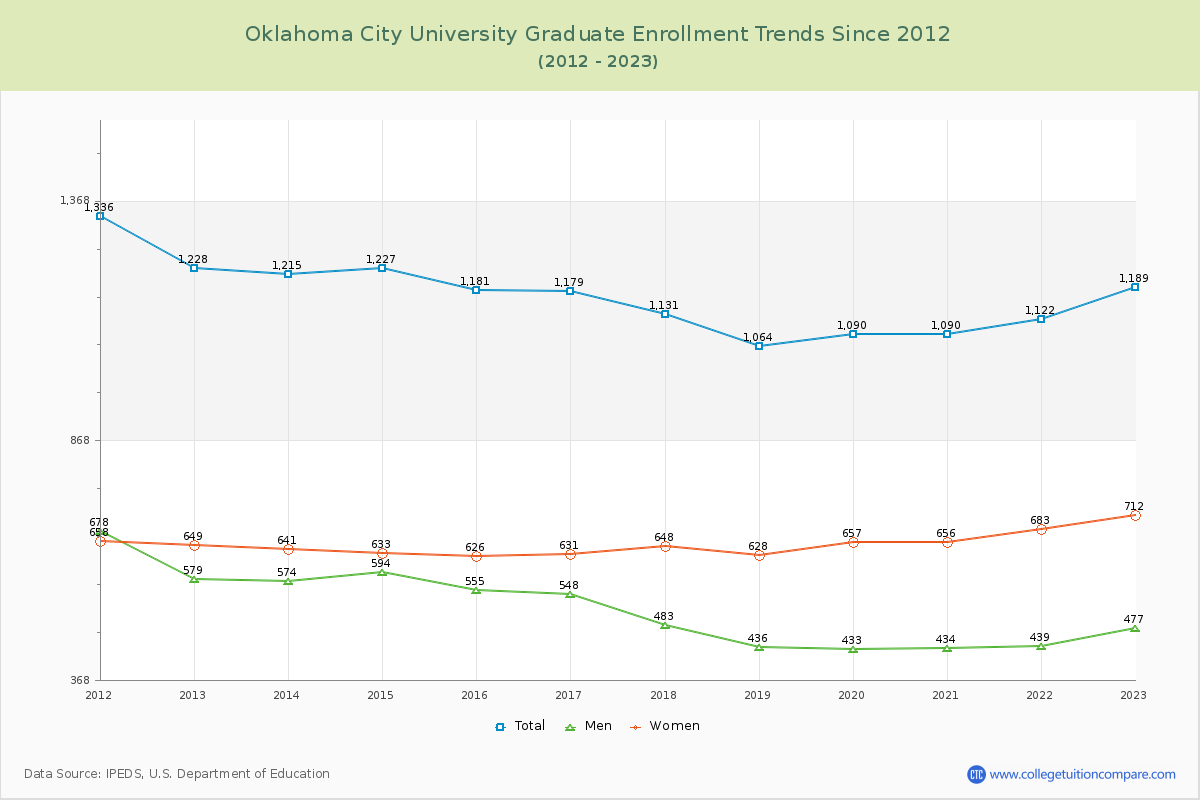
53.37% of total students is undergraduate students and 46.63% students is graduate students. The number of undergraduate students has decreased by 710 and the graduate enrollment has decreased by 39 over past 10 years.
The female to male ratio is 1.70 to 1 and it means that there are more female students enrolled in Oklahoma City than male students.
The following table and chart illustrate the changes in student population by gender at Oklahoma City University since 2012.
| Year | Total | Undergraduate | Graduate | ||||
|---|---|---|---|---|---|---|---|
| Total | Men | Women | Total | Men | Women | ||
| 2012-13 | 3,299 | 2,071 | 782 | 1,289 | 1,228 | 579 | 649 |
| 2013-14 | 3,179 -120 | 1,964 -107 | 749 -33 | 1,215 -74 | 1,215 -13 | 574 -5 | 641 -8 |
| 2014-15 | 3,035 -144 | 1,808 -156 | 663 -86 | 1,145 -70 | 1,227 12 | 594 20 | 633 -8 |
| 2015-16 | 2,991 -44 | 1,810 2 | 630 -33 | 1,180 35 | 1,181 -46 | 555 -39 | 626 -7 |
| 2016-17 | 2,968 -23 | 1,789 -21 | 604 -26 | 1,185 5 | 1,179 -2 | 548 -7 | 631 5 |
| 2017-18 | 2,845 -123 | 1,714 -75 | 549 -55 | 1,165 -20 | 1,131 -48 | 483 -65 | 648 17 |
| 2018-19 | 2,773 -72 | 1,709 -5 | 553 4 | 1,156 -9 | 1,064 -67 | 436 -47 | 628 -20 |
| 2019-20 | 2,687 -86 | 1,597 -112 | 522 -31 | 1,075 -81 | 1,090 26 | 433 -3 | 657 29 |
| 2020-21 | 2,617 -70 | 1,527 -70 | 498 -24 | 1,029 -46 | 1,090 0 | 434 1 | 656 -1 |
| 2021-22 | 2,551 -66 | 1,429 -98 | 479 -19 | 950 -79 | 1,122 32 | 439 5 | 683 27 |
| 2022-23 | 2,550 -1 | 1,361 -68 | 469 -10 | 892 -58 | 1,189 67 | 477 38 | 712 29 |
| Average | 2,863 | 1,707 | 591 | 1,116 | 1,156 | 505 | 651 |