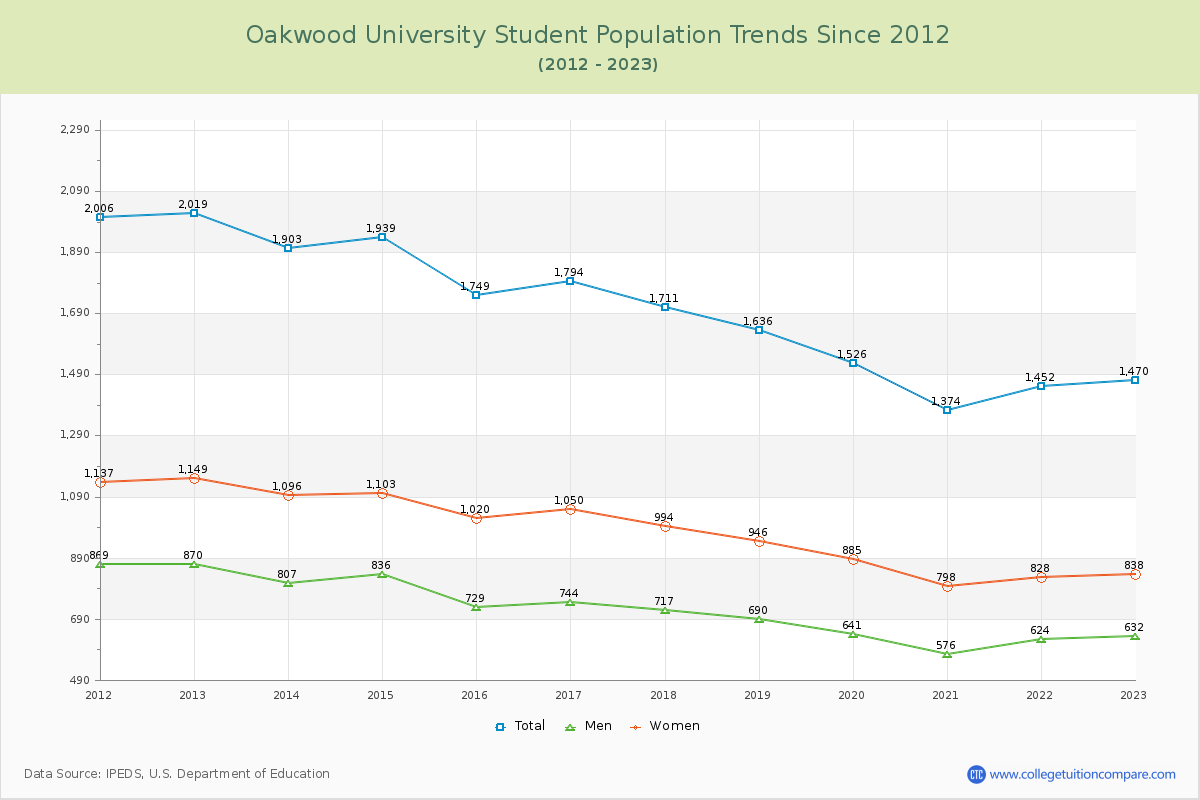
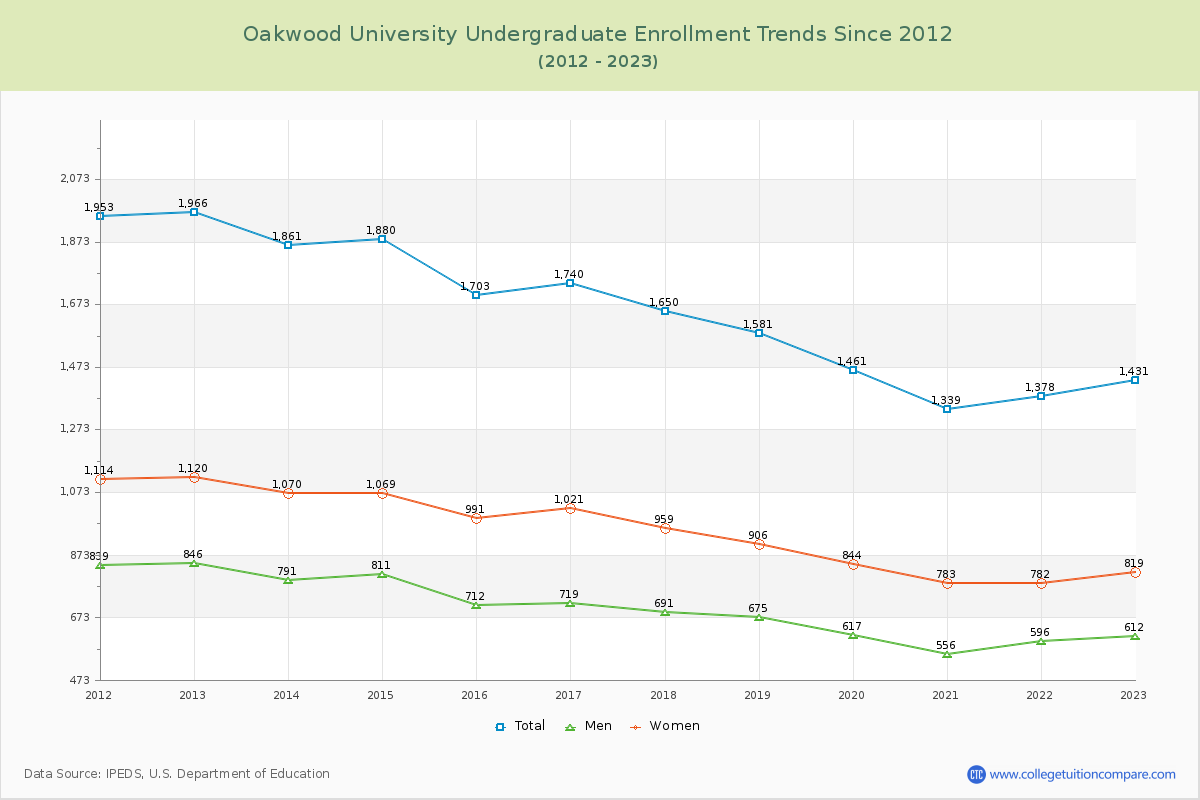
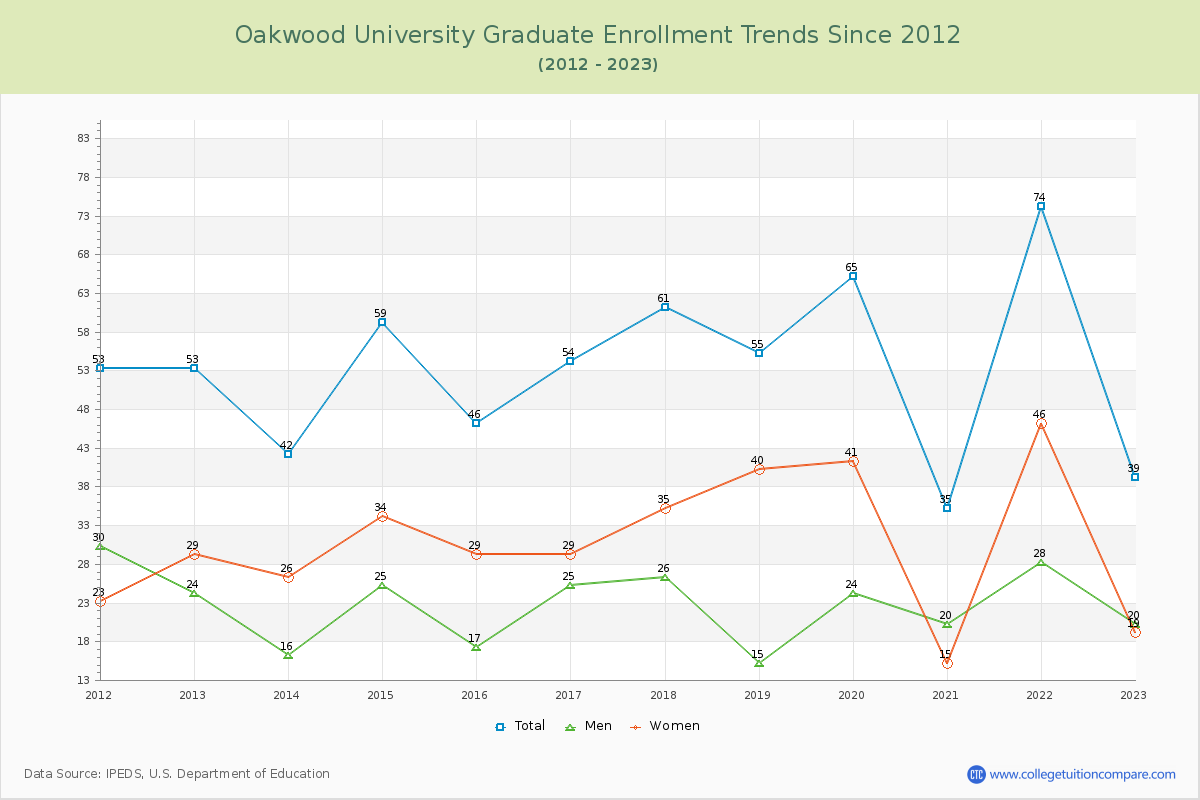
Student Population Changes
The average student population over the last 12 years is 1,688 where 1,470 students are attending the school for the academic year 2022-2023.
97.35% of total students is undergraduate students and 2.65% students is graduate students. The number of undergraduate students has decreased by 535 and the graduate enrollment has decreased by 14 over past 10 years.
The female to male ratio is 1.33 to 1 and it means that there are more female students enrolled in Oakwood than male students.
The following table and chart illustrate the changes in student population by gender at Oakwood University since 2012.
| Year | Total | Undergraduate | Graduate | ||||
|---|---|---|---|---|---|---|---|
| Total | Men | Women | Total | Men | Women | ||
| 2012-13 | 2,019 | 1,966 | 846 | 1,120 | 53 | 24 | 29 |
| 2013-14 | 1,903 -116 | 1,861 -105 | 791 -55 | 1,070 -50 | 42 -11 | 16 -8 | 26 -3 |
| 2014-15 | 1,939 36 | 1,880 19 | 811 20 | 1,069 -1 | 59 17 | 25 9 | 34 8 |
| 2015-16 | 1,749 -190 | 1,703 -177 | 712 -99 | 991 -78 | 46 -13 | 17 -8 | 29 -5 |
| 2016-17 | 1,794 45 | 1,740 37 | 719 7 | 1,021 30 | 54 8 | 25 8 | 29 0 |
| 2017-18 | 1,711 -83 | 1,650 -90 | 691 -28 | 959 -62 | 61 7 | 26 1 | 35 6 |
| 2018-19 | 1,636 -75 | 1,581 -69 | 675 -16 | 906 -53 | 55 -6 | 15 -11 | 40 5 |
| 2019-20 | 1,526 -110 | 1,461 -120 | 617 -58 | 844 -62 | 65 10 | 24 9 | 41 1 |
| 2020-21 | 1,374 -152 | 1,339 -122 | 556 -61 | 783 -61 | 35 -30 | 20 -4 | 15 -26 |
| 2021-22 | 1,452 78 | 1,378 39 | 596 40 | 782 -1 | 74 39 | 28 8 | 46 31 |
| 2022-23 | 1,470 18 | 1,431 53 | 612 16 | 819 37 | 39 -35 | 20 -8 | 19 -27 |
| Average | 1,688 | 1,635 | 693 | 942 | 53 | 22 | 31 |