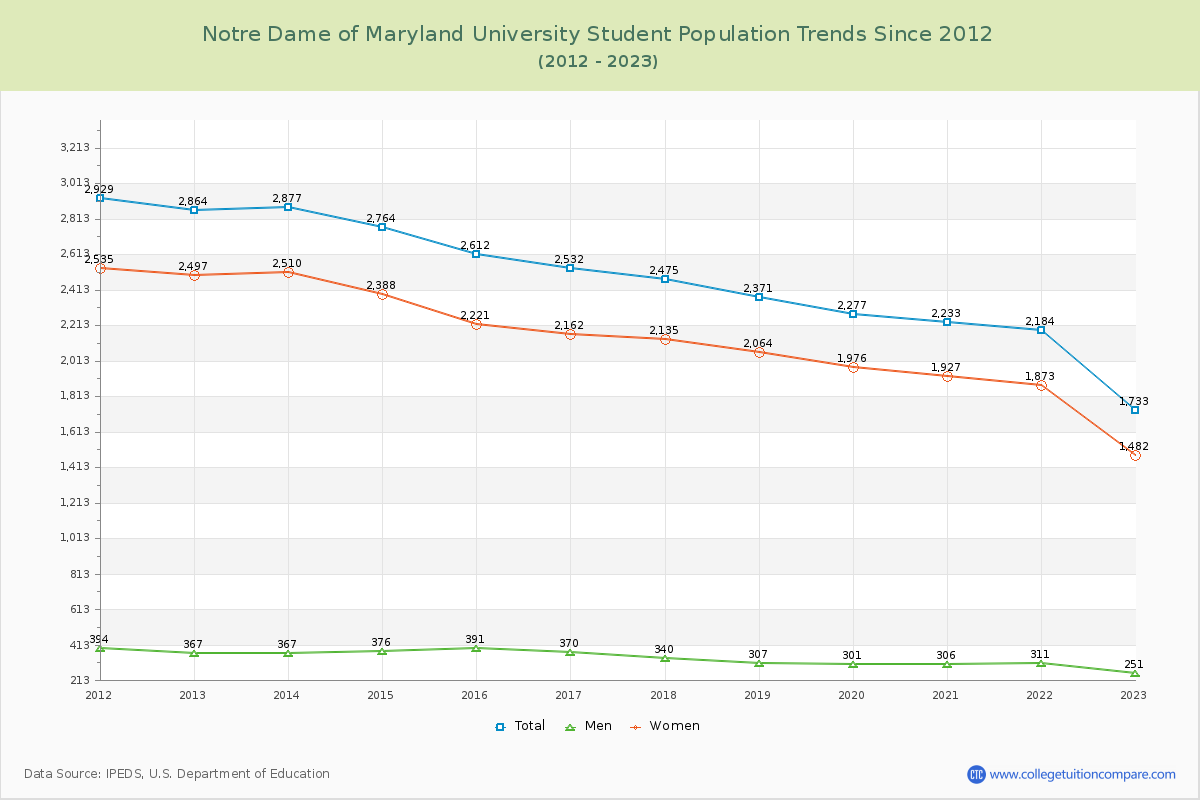
Student Population Changes
The average student population over the last 12 years is 2,447 where 1,733 students are attending the school for the academic year 2022-2023.
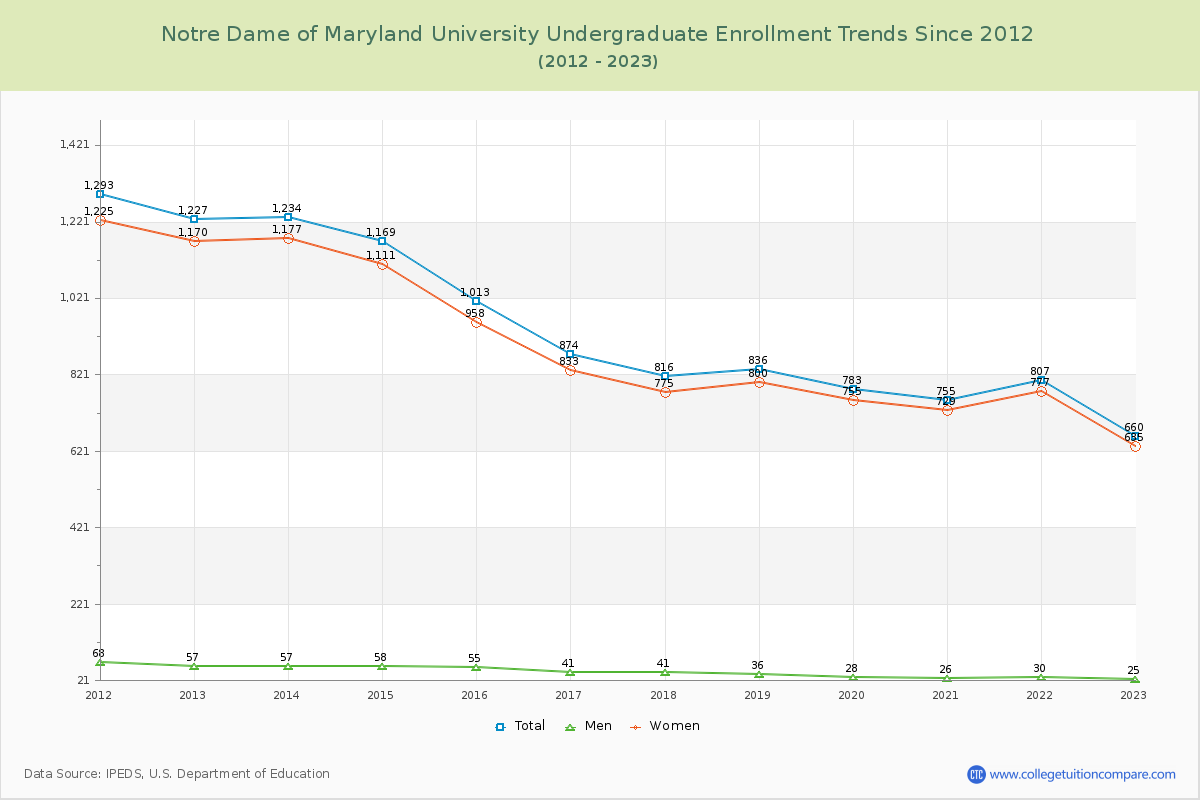
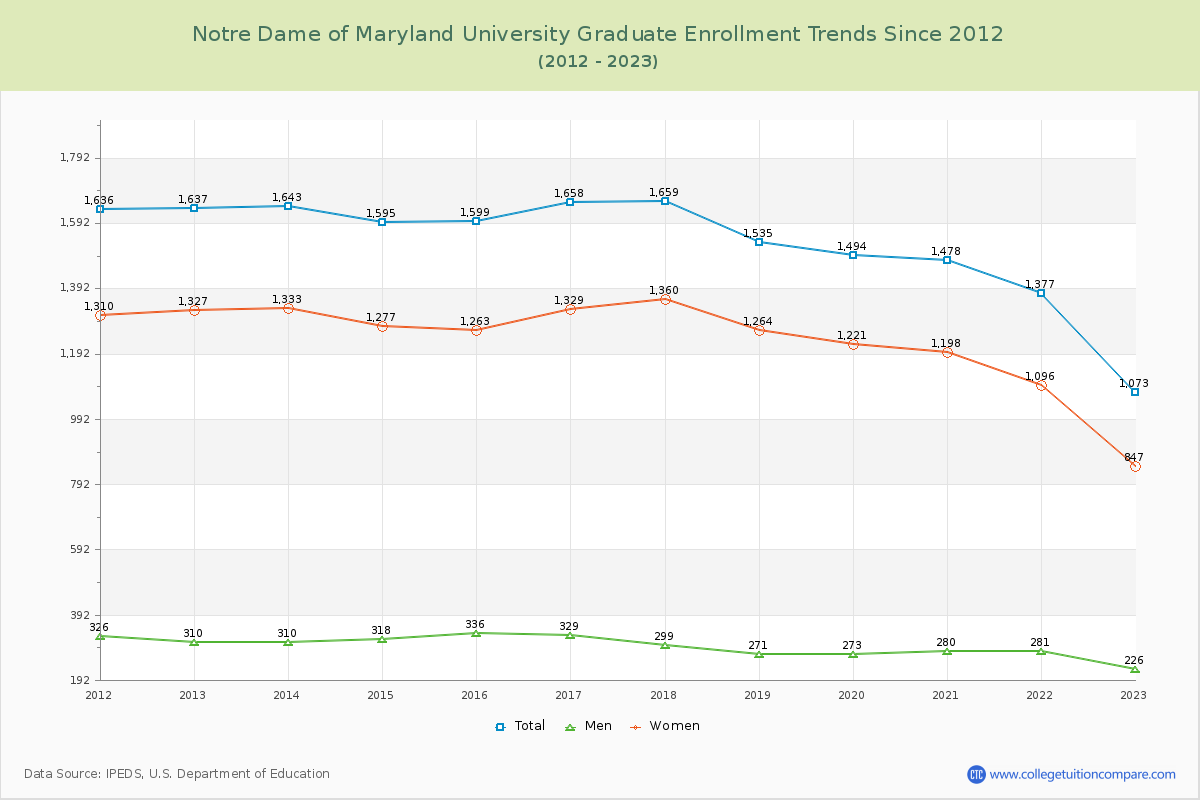
38.08% of total students is undergraduate students and 61.92% students is graduate students. The number of undergraduate students has decreased by 567 and the graduate enrollment has decreased by 564 over past 10 years.
The following table and chart illustrate the changes in student population by gender at Notre Dame of Maryland University since 2012.
| Year | Total | Undergraduate | Graduate | ||||
|---|---|---|---|---|---|---|---|
| Total | Men | Women | Total | Men | Women | ||
| 2012-13 | 2,864 | 1,227 | 57 | 1,170 | 1,637 | 310 | 1,327 |
| 2013-14 | 2,877 13 | 1,234 7 | 57 0 | 1,177 7 | 1,643 6 | 310 0 | 1,333 6 |
| 2014-15 | 2,764 -113 | 1,169 -65 | 58 1 | 1,111 -66 | 1,595 -48 | 318 8 | 1,277 -56 |
| 2015-16 | 2,612 -152 | 1,013 -156 | 55 -3 | 958 -153 | 1,599 4 | 336 18 | 1,263 -14 |
| 2016-17 | 2,532 -80 | 874 -139 | 41 -14 | 833 -125 | 1,658 59 | 329 -7 | 1,329 66 |
| 2017-18 | 2,475 -57 | 816 -58 | 41 0 | 775 -58 | 1,659 1 | 299 -30 | 1,360 31 |
| 2018-19 | 2,371 -104 | 836 20 | 36 -5 | 800 25 | 1,535 -124 | 271 -28 | 1,264 -96 |
| 2019-20 | 2,277 -94 | 783 -53 | 28 -8 | 755 -45 | 1,494 -41 | 273 2 | 1,221 -43 |
| 2020-21 | 2,233 -44 | 755 -28 | 26 -2 | 729 -26 | 1,478 -16 | 280 7 | 1,198 -23 |
| 2021-22 | 2,184 -49 | 807 52 | 30 4 | 777 48 | 1,377 -101 | 281 1 | 1,096 -102 |
| 2022-23 | 1,733 -451 | 660 -147 | 25 -5 | 635 -142 | 1,073 -304 | 226 -55 | 847 -249 |
| Average | 2,447 | 925 | 41 | 884 | 1,523 | 294 | 1,229 |