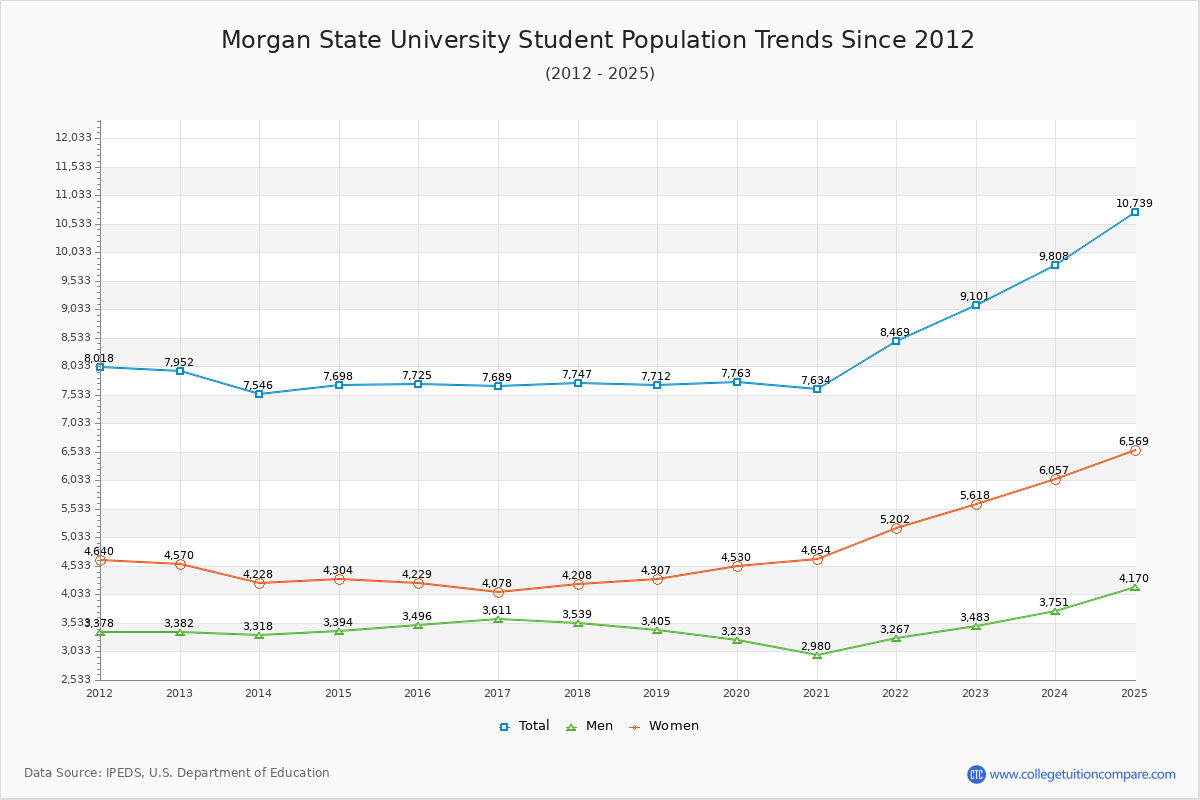
Student Population Changes
The average student population over the last 12 years is 7,912 where 9,101 students are attending the school for the academic year 2022-2023.
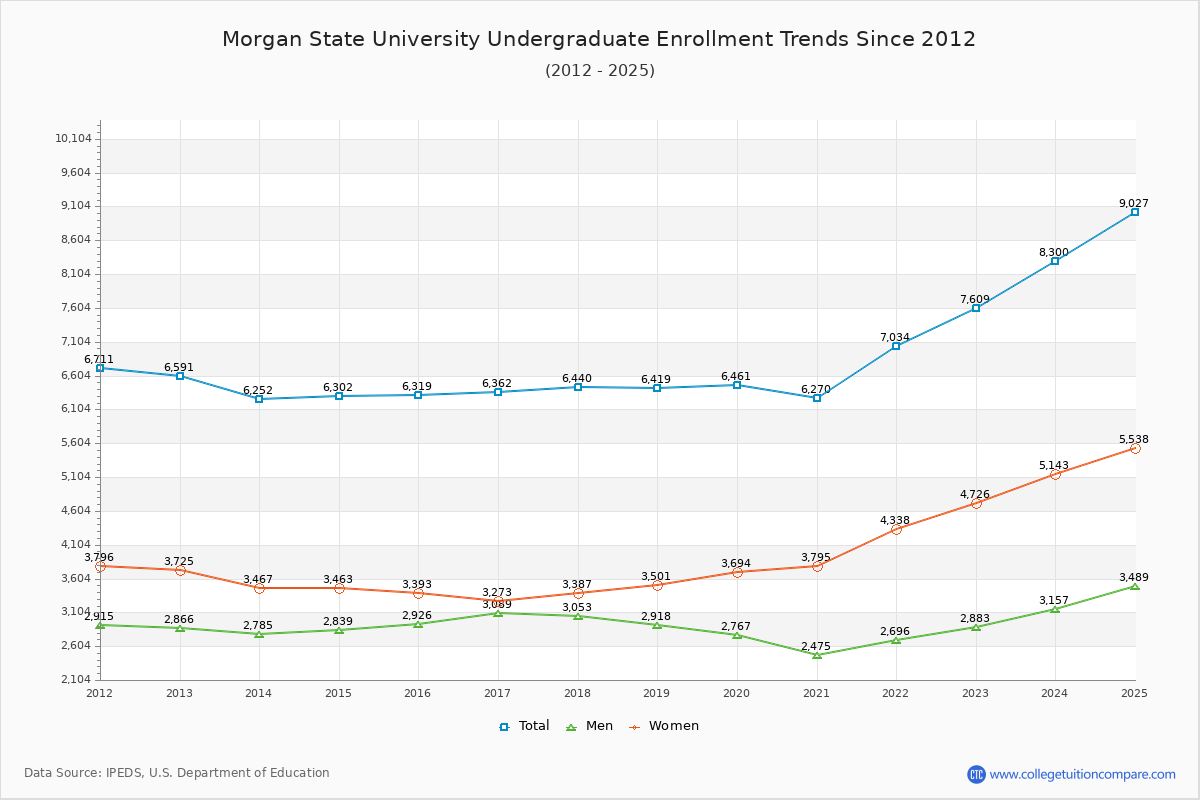
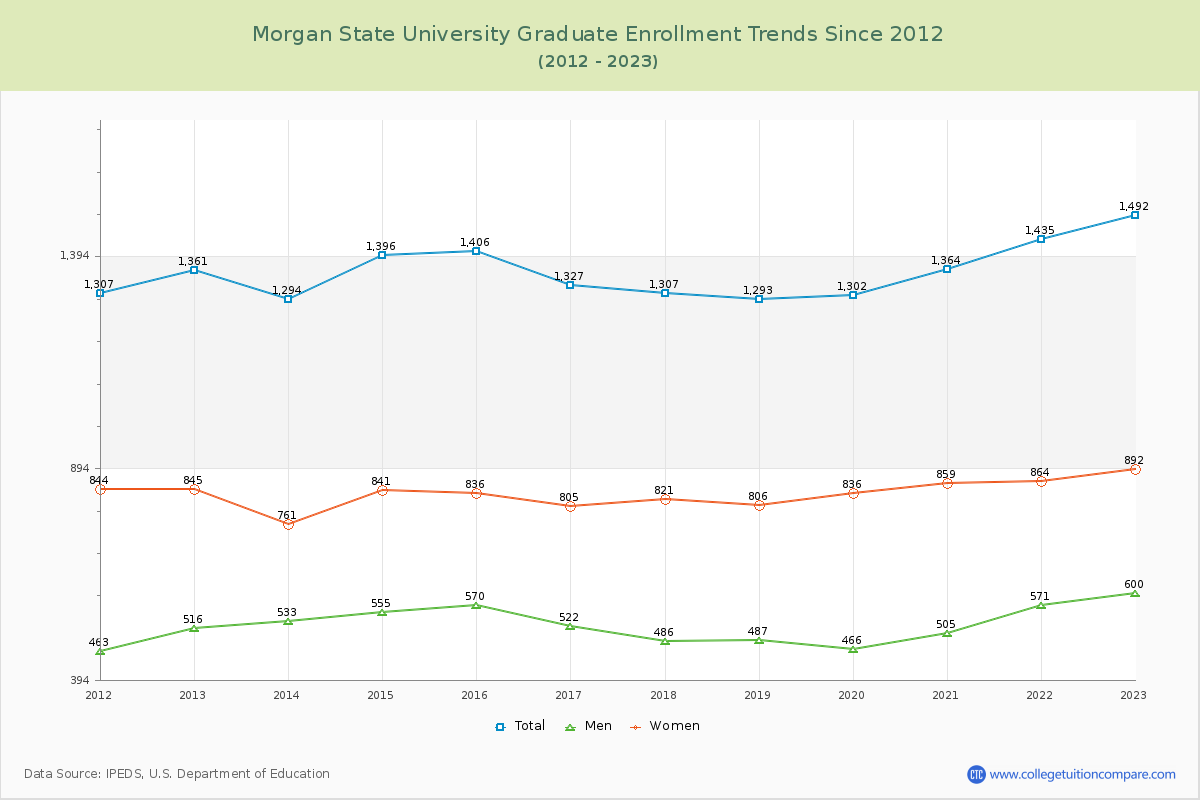
83.61% of total students is undergraduate students and 16.39% students is graduate students. The number of undergraduate students has increased by 1,018 and the graduate enrollment has increased by 131 over past 10 years.
The female to male ratio is 1.61 to 1 and it means that there are more female students enrolled in Morgan State than male students.
The following table and chart illustrate the changes in student population by gender at Morgan State University since 2012.
| Year | Total | Undergraduate | Graduate | ||||
|---|---|---|---|---|---|---|---|
| Total | Men | Women | Total | Men | Women | ||
| 2012-13 | 7,952 | 6,591 | 2,866 | 3,725 | 1,361 | 516 | 845 |
| 2013-14 | 7,546 -406 | 6,252 -339 | 2,785 -81 | 3,467 -258 | 1,294 -67 | 533 17 | 761 -84 |
| 2014-15 | 7,698 152 | 6,302 50 | 2,839 54 | 3,463 -4 | 1,396 102 | 555 22 | 841 80 |
| 2015-16 | 7,725 27 | 6,319 17 | 2,926 87 | 3,393 -70 | 1,406 10 | 570 15 | 836 -5 |
| 2016-17 | 7,689 -36 | 6,362 43 | 3,089 163 | 3,273 -120 | 1,327 -79 | 522 -48 | 805 -31 |
| 2017-18 | 7,747 58 | 6,440 78 | 3,053 -36 | 3,387 114 | 1,307 -20 | 486 -36 | 821 16 |
| 2018-19 | 7,712 -35 | 6,419 -21 | 2,918 -135 | 3,501 114 | 1,293 -14 | 487 1 | 806 -15 |
| 2019-20 | 7,763 51 | 6,461 42 | 2,767 -151 | 3,694 193 | 1,302 9 | 466 -21 | 836 30 |
| 2020-21 | 7,634 -129 | 6,270 -191 | 2,475 -292 | 3,795 101 | 1,364 62 | 505 39 | 859 23 |
| 2021-22 | 8,469 835 | 7,034 764 | 2,696 221 | 4,338 543 | 1,435 71 | 571 66 | 864 5 |
| 2022-23 | 9,101 632 | 7,609 575 | 2,883 187 | 4,726 388 | 1,492 57 | 600 29 | 892 28 |
| Average | 7,912 | 6,551 | 2,845 | 3,706 | 1,362 | 528 | 833 |