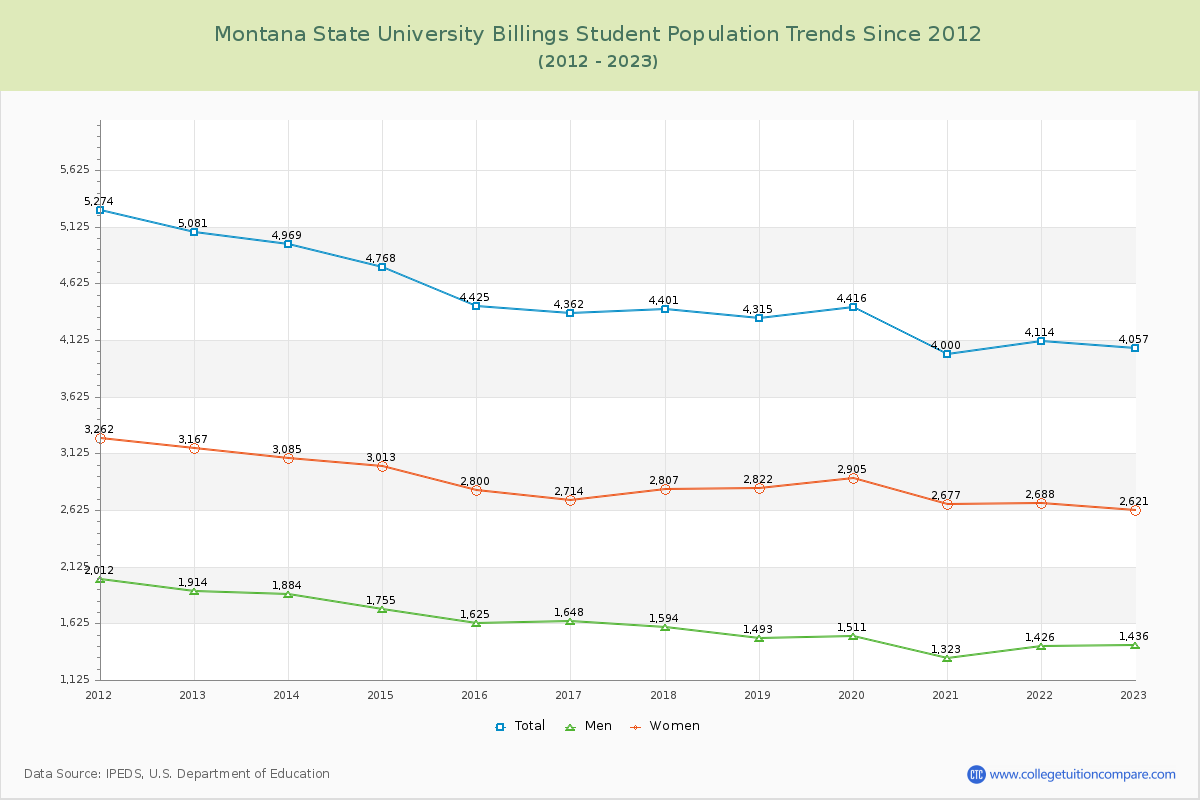
Student Population Changes
The average student population over the last 12 years is 4,446 where 4,057 students are attending the school for the academic year 2022-2023.
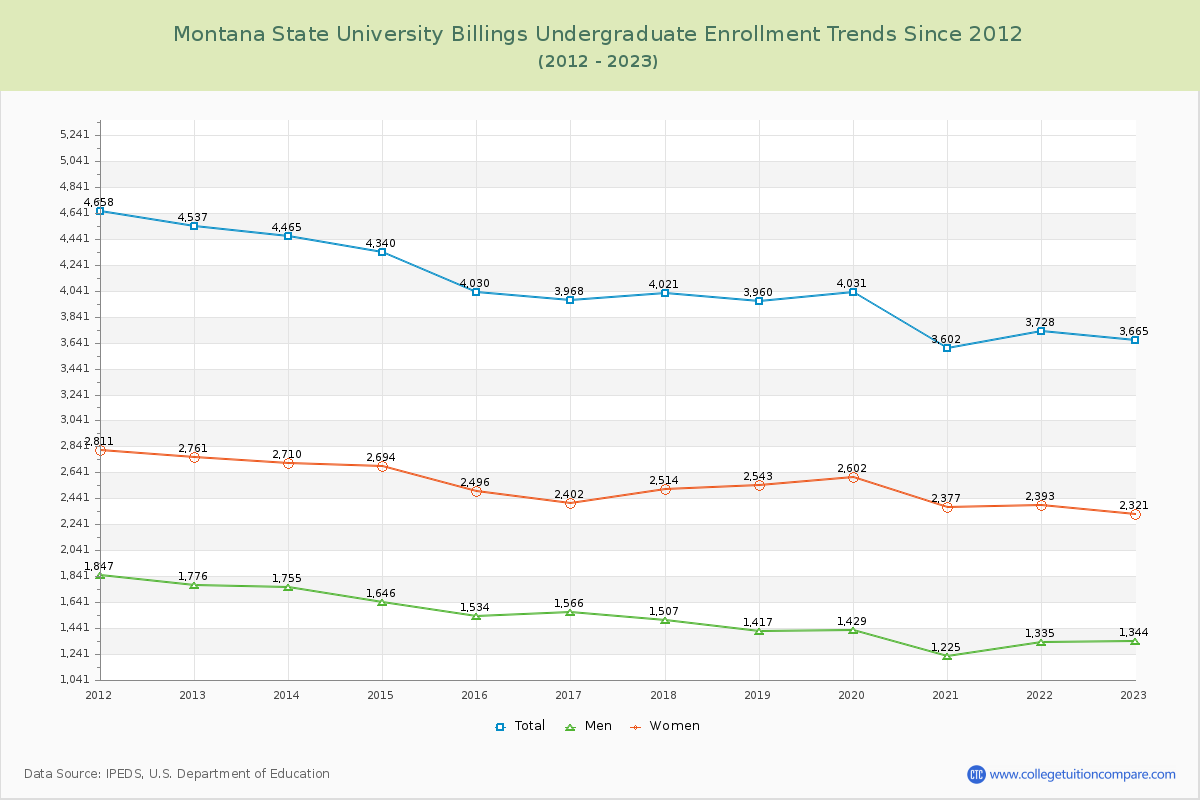
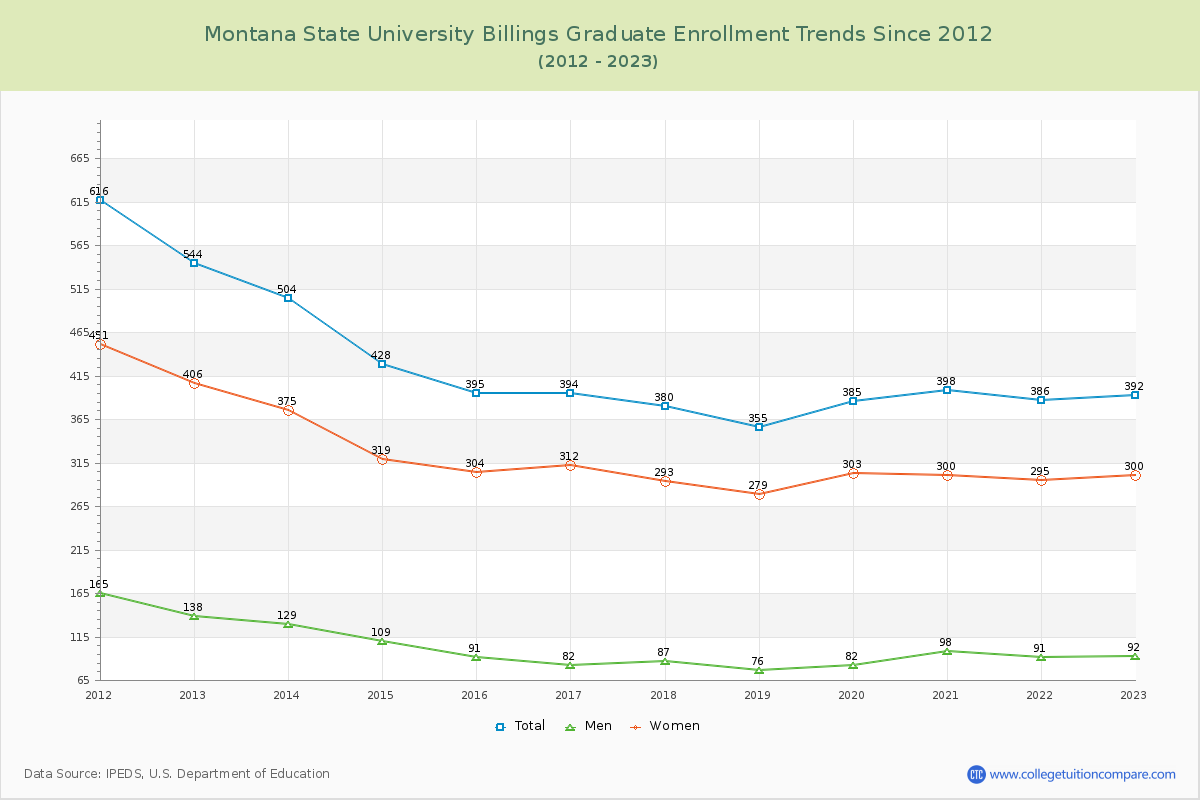
90.34% of total students is undergraduate students and 9.66% students is graduate students. The number of undergraduate students has decreased by 872 and the graduate enrollment has decreased by 152 over past 10 years.
The female to male ratio is 1.83 to 1 and it means that there are more female students enrolled in MSU Billings than male students.
The following table and chart illustrate the changes in student population by gender at Montana State University Billings since 2012.
| Year | Total | Undergraduate | Graduate | ||||
|---|---|---|---|---|---|---|---|
| Total | Men | Women | Total | Men | Women | ||
| 2012-13 | 5,081 | 4,537 | 1,776 | 2,761 | 544 | 138 | 406 |
| 2013-14 | 4,969 -112 | 4,465 -72 | 1,755 -21 | 2,710 -51 | 504 -40 | 129 -9 | 375 -31 |
| 2014-15 | 4,768 -201 | 4,340 -125 | 1,646 -109 | 2,694 -16 | 428 -76 | 109 -20 | 319 -56 |
| 2015-16 | 4,425 -343 | 4,030 -310 | 1,534 -112 | 2,496 -198 | 395 -33 | 91 -18 | 304 -15 |
| 2016-17 | 4,362 -63 | 3,968 -62 | 1,566 32 | 2,402 -94 | 394 -1 | 82 -9 | 312 8 |
| 2017-18 | 4,401 39 | 4,021 53 | 1,507 -59 | 2,514 112 | 380 -14 | 87 5 | 293 -19 |
| 2018-19 | 4,315 -86 | 3,960 -61 | 1,417 -90 | 2,543 29 | 355 -25 | 76 -11 | 279 -14 |
| 2019-20 | 4,416 101 | 4,031 71 | 1,429 12 | 2,602 59 | 385 30 | 82 6 | 303 24 |
| 2020-21 | 4,000 -416 | 3,602 -429 | 1,225 -204 | 2,377 -225 | 398 13 | 98 16 | 300 -3 |
| 2021-22 | 4,114 114 | 3,728 126 | 1,335 110 | 2,393 16 | 386 -12 | 91 -7 | 295 -5 |
| 2022-23 | 4,057 -57 | 3,665 -63 | 1,344 9 | 2,321 -72 | 392 6 | 92 1 | 300 5 |
| Average | 4,446 | 4,032 | 1,503 | 2,528 | 415 | 98 | 317 |