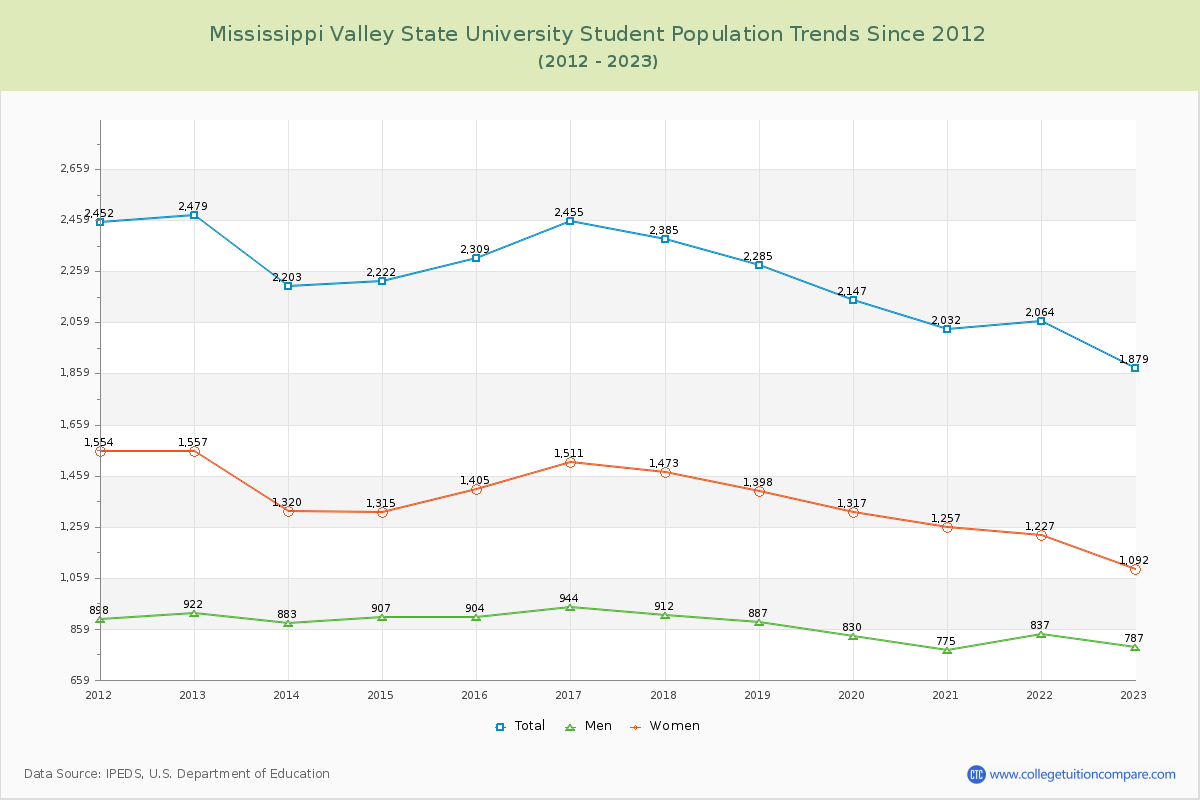
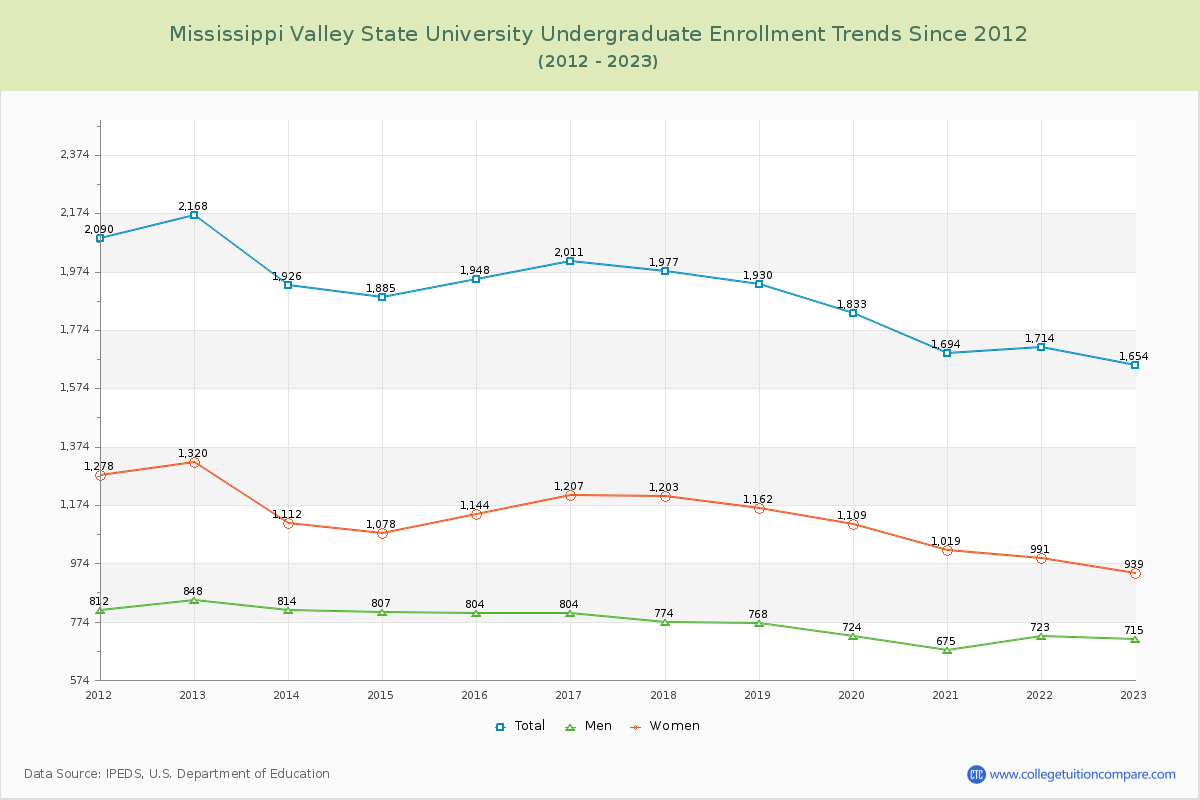
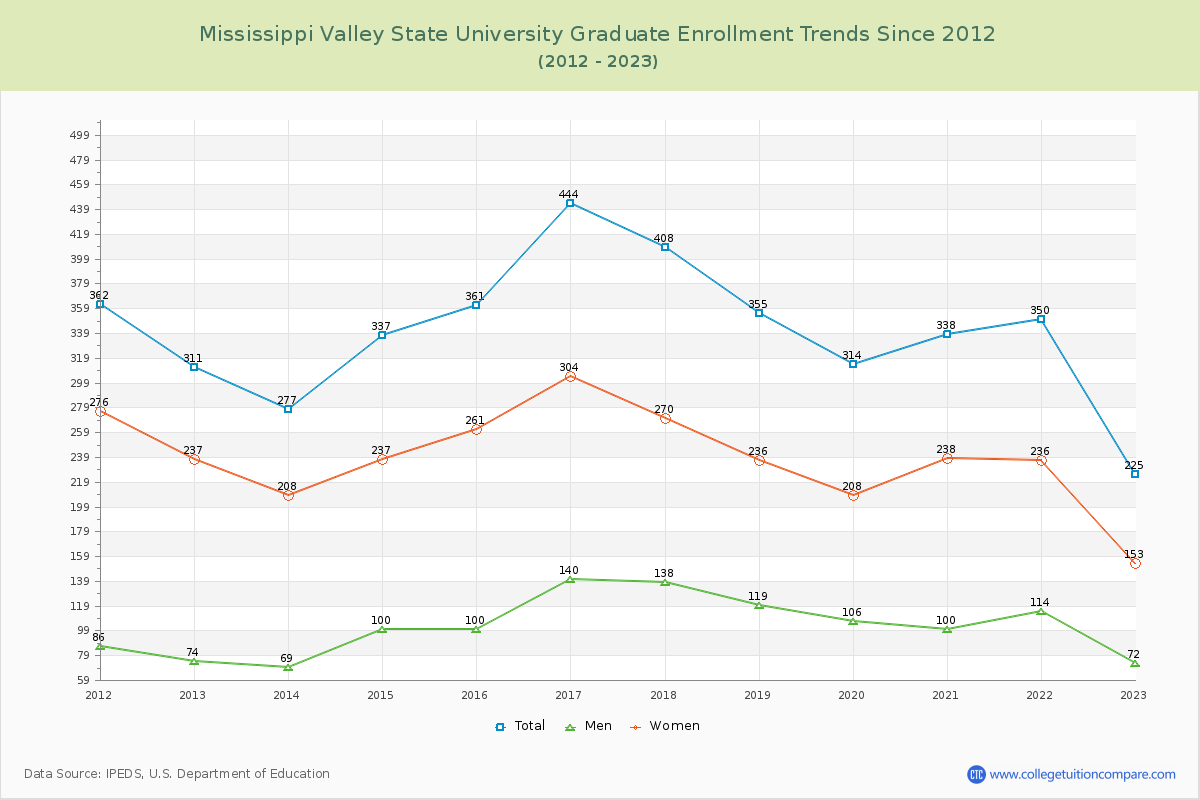
Student Population Changes
The average student population over the last 12 years is 2,224 where 1,879 students are attending the school for the academic year 2022-2023.
88.03% of total students is undergraduate students and 11.97% students is graduate students. The number of undergraduate students has decreased by 514 and the graduate enrollment has decreased by 86 over past 10 years.
The female to male ratio is 1.39 to 1 and it means that there are more female students enrolled in Mississippi Valley State than male students.
The following table and chart illustrate the changes in student population by gender at Mississippi Valley State University since 2012.
| Year | Total | Undergraduate | Graduate | ||||
|---|---|---|---|---|---|---|---|
| Total | Men | Women | Total | Men | Women | ||
| 2012-13 | 2,479 | 2,168 | 848 | 1,320 | 311 | 74 | 237 |
| 2013-14 | 2,203 -276 | 1,926 -242 | 814 -34 | 1,112 -208 | 277 -34 | 69 -5 | 208 -29 |
| 2014-15 | 2,222 19 | 1,885 -41 | 807 -7 | 1,078 -34 | 337 60 | 100 31 | 237 29 |
| 2015-16 | 2,309 87 | 1,948 63 | 804 -3 | 1,144 66 | 361 24 | 100 0 | 261 24 |
| 2016-17 | 2,455 146 | 2,011 63 | 804 0 | 1,207 63 | 444 83 | 140 40 | 304 43 |
| 2017-18 | 2,385 -70 | 1,977 -34 | 774 -30 | 1,203 -4 | 408 -36 | 138 -2 | 270 -34 |
| 2018-19 | 2,285 -100 | 1,930 -47 | 768 -6 | 1,162 -41 | 355 -53 | 119 -19 | 236 -34 |
| 2019-20 | 2,147 -138 | 1,833 -97 | 724 -44 | 1,109 -53 | 314 -41 | 106 -13 | 208 -28 |
| 2020-21 | 2,032 -115 | 1,694 -139 | 675 -49 | 1,019 -90 | 338 24 | 100 -6 | 238 30 |
| 2021-22 | 2,064 32 | 1,714 20 | 723 48 | 991 -28 | 350 12 | 114 14 | 236 -2 |
| 2022-23 | 1,879 -185 | 1,654 -60 | 715 -8 | 939 -52 | 225 -125 | 72 -42 | 153 -83 |
| Average | 2,224 | 1,885 | 769 | 1,117 | 338 | 103 | 235 |