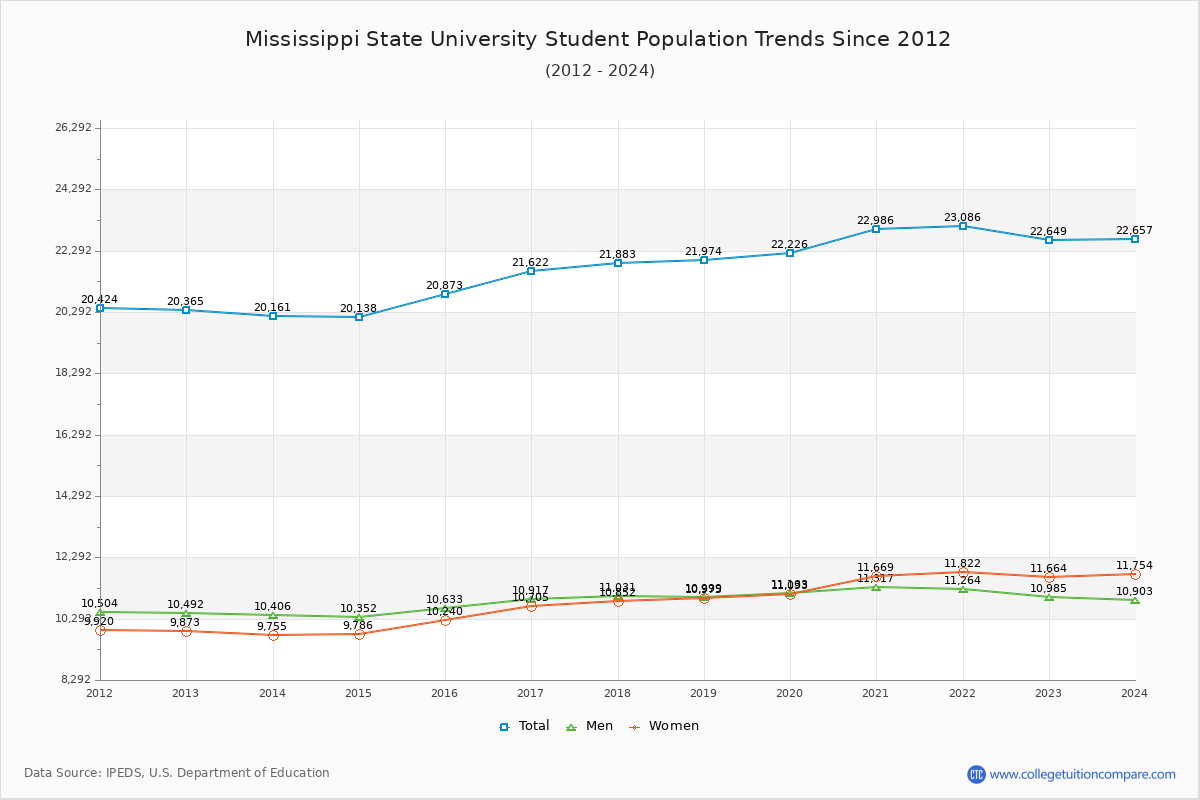
Student Population Changes
The average student population over the last 12 years is 21,633 where 22,649 students are attending the school for the academic year 2022-2023.
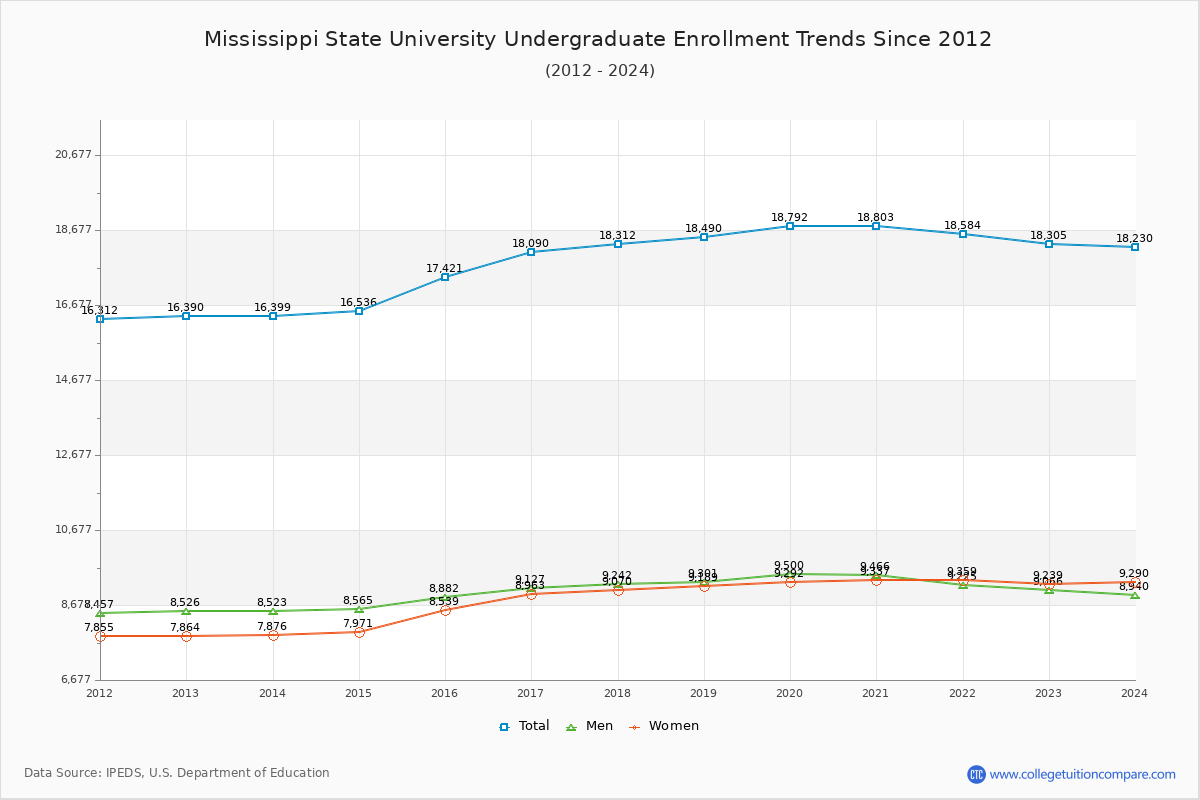
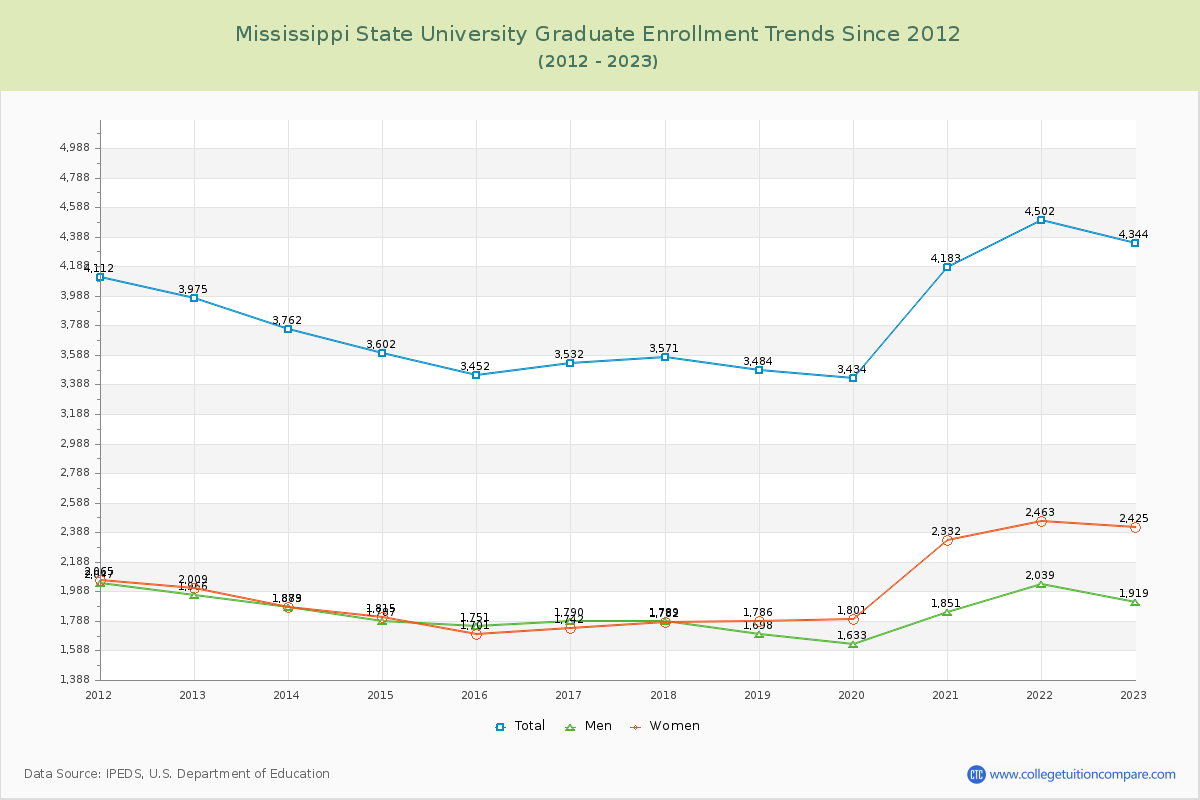
80.82% of total students is undergraduate students and 19.18% students is graduate students. The number of undergraduate students has increased by 1,915 and the graduate enrollment has increased by 369 over past 10 years.
The female to male ratio is 1.06 to 1 and it means that there are similar numbers of female and male students enrolled in Mississippi State.
The following table and chart illustrate the changes in student population by gender at Mississippi State University since 2012.
| Year | Total | Undergraduate | Graduate | ||||
|---|---|---|---|---|---|---|---|
| Total | Men | Women | Total | Men | Women | ||
| 2012-13 | 20,365 | 16,390 | 8,526 | 7,864 | 3,975 | 1,966 | 2,009 |
| 2013-14 | 20,161 -204 | 16,399 9 | 8,523 -3 | 7,876 12 | 3,762 -213 | 1,883 -83 | 1,879 -130 |
| 2014-15 | 20,138 -23 | 16,536 137 | 8,565 42 | 7,971 95 | 3,602 -160 | 1,787 -96 | 1,815 -64 |
| 2015-16 | 20,873 735 | 17,421 885 | 8,882 317 | 8,539 568 | 3,452 -150 | 1,751 -36 | 1,701 -114 |
| 2016-17 | 21,622 749 | 18,090 669 | 9,127 245 | 8,963 424 | 3,532 80 | 1,790 39 | 1,742 41 |
| 2017-18 | 21,883 261 | 18,312 222 | 9,242 115 | 9,070 107 | 3,571 39 | 1,789 -1 | 1,782 40 |
| 2018-19 | 21,974 91 | 18,490 178 | 9,301 59 | 9,189 119 | 3,484 -87 | 1,698 -91 | 1,786 4 |
| 2019-20 | 22,226 252 | 18,792 302 | 9,500 199 | 9,292 103 | 3,434 -50 | 1,633 -65 | 1,801 15 |
| 2020-21 | 22,986 760 | 18,803 11 | 9,466 -34 | 9,337 45 | 4,183 749 | 1,851 218 | 2,332 531 |
| 2021-22 | 23,086 100 | 18,584 -219 | 9,225 -241 | 9,359 22 | 4,502 319 | 2,039 188 | 2,463 131 |
| 2022-23 | 22,649 -437 | 18,305 -279 | 9,066 -159 | 9,239 -120 | 4,344 -158 | 1,919 -120 | 2,425 -38 |
| Average | 21,633 | 17,829 | 9,038 | 8,791 | 3,804 | 1,828 | 1,976 |