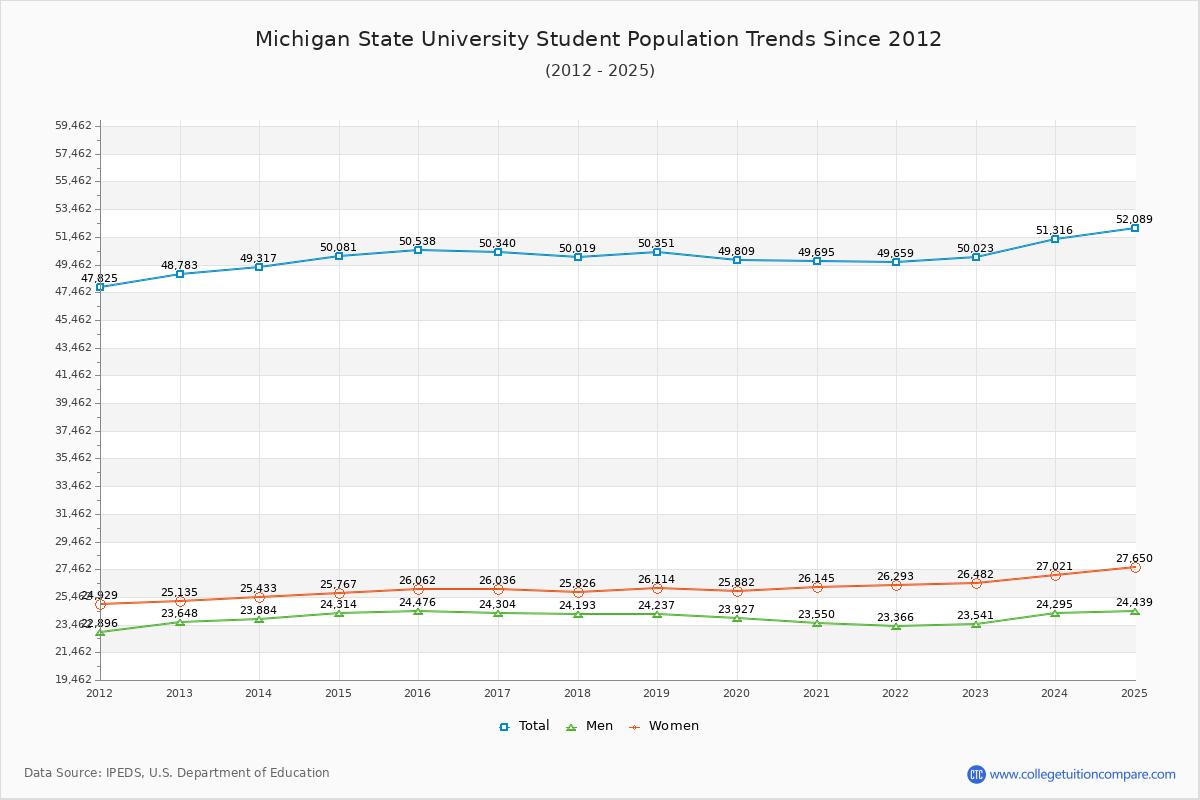
Student Population Changes
The average student population over the last 12 years is 49,874 where 50,023 students are attending the school for the academic year 2022-2023.
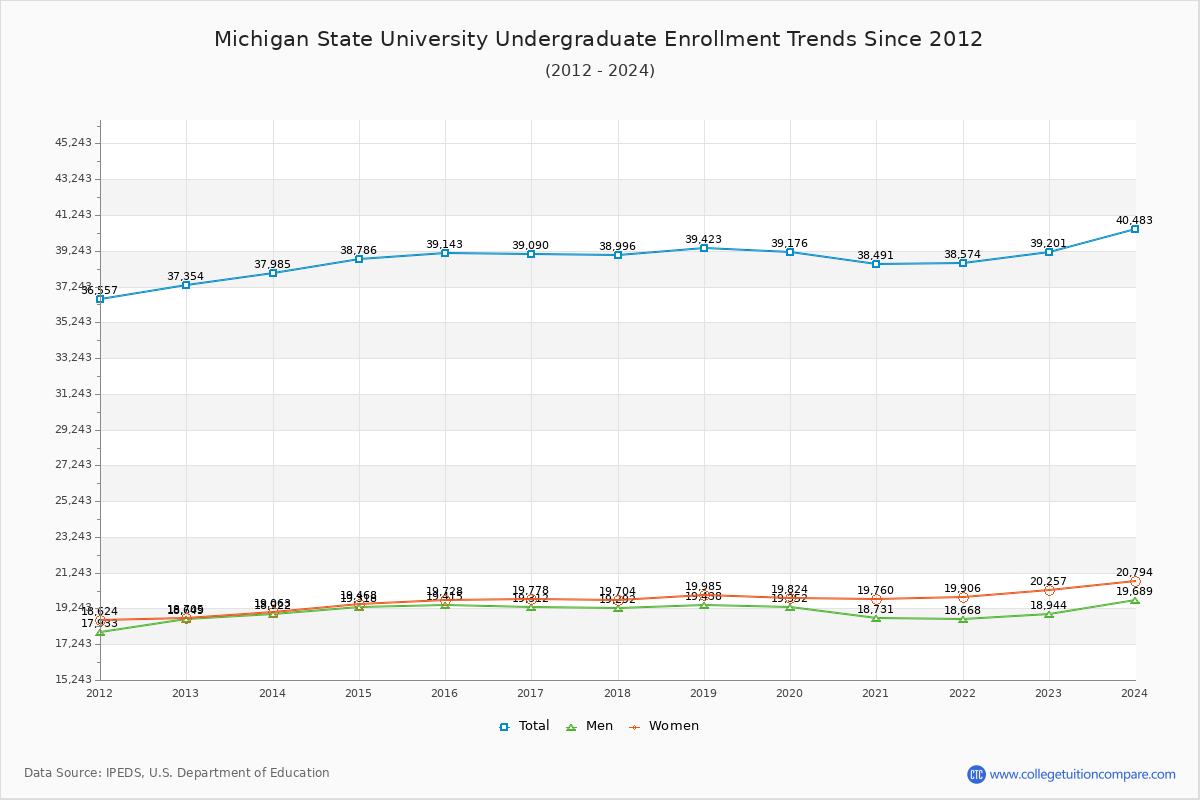
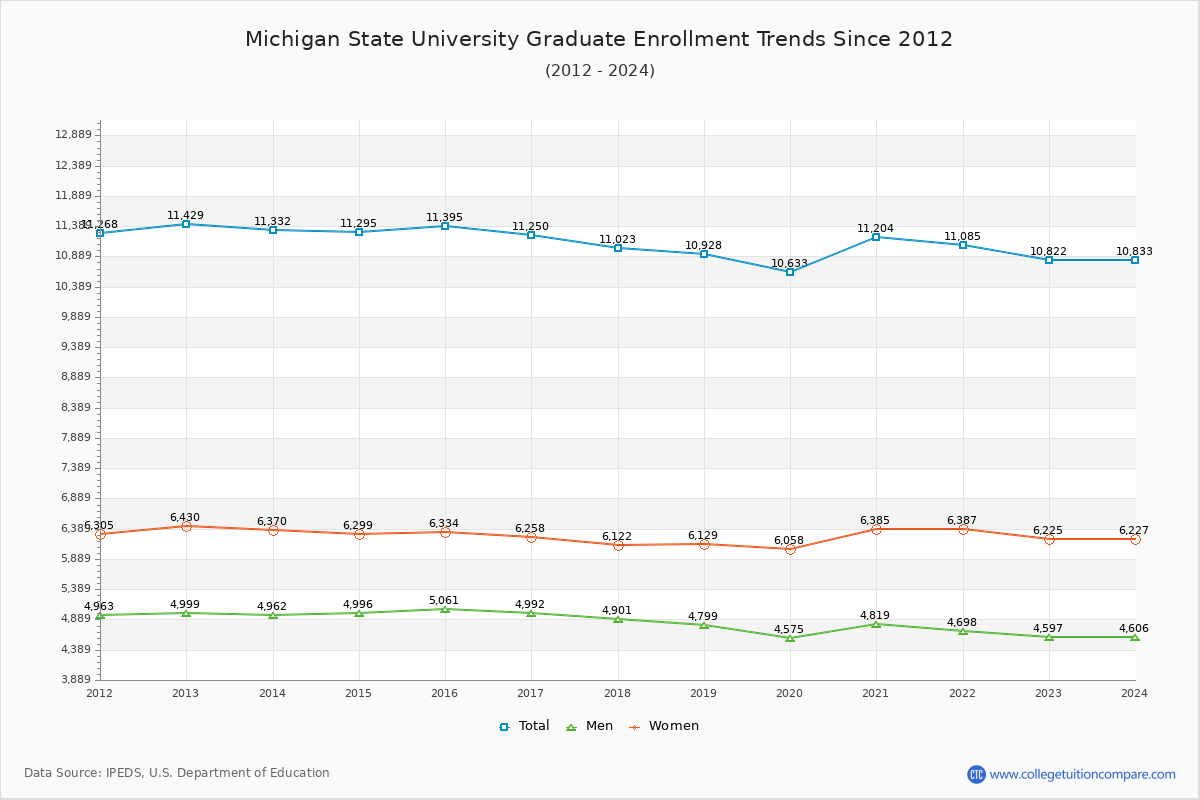
78.37% of total students is undergraduate students and 21.63% students is graduate students. The number of undergraduate students has increased by 1,847 and the graduate enrollment has decreased by 607 over past 10 years.
The female to male ratio is 1.12 to 1 and it means that there are slightly more female students enrolled in MSU than male students.
The following table and chart illustrate the changes in student population by gender at Michigan State University since 2012.
| Year | Total | Undergraduate | Graduate | ||||
|---|---|---|---|---|---|---|---|
| Total | Men | Women | Total | Men | Women | ||
| 2012-13 | 48,783 | 37,354 | 18,649 | 18,705 | 11,429 | 4,999 | 6,430 |
| 2013-14 | 49,317 534 | 37,985 631 | 18,922 273 | 19,063 358 | 11,332 -97 | 4,962 -37 | 6,370 -60 |
| 2014-15 | 50,081 764 | 38,786 801 | 19,318 396 | 19,468 405 | 11,295 -37 | 4,996 34 | 6,299 -71 |
| 2015-16 | 50,538 457 | 39,143 357 | 19,415 97 | 19,728 260 | 11,395 100 | 5,061 65 | 6,334 35 |
| 2016-17 | 50,340 -198 | 39,090 -53 | 19,312 -103 | 19,778 50 | 11,250 -145 | 4,992 -69 | 6,258 -76 |
| 2017-18 | 50,019 -321 | 38,996 -94 | 19,292 -20 | 19,704 -74 | 11,023 -227 | 4,901 -91 | 6,122 -136 |
| 2018-19 | 50,351 332 | 39,423 427 | 19,438 146 | 19,985 281 | 10,928 -95 | 4,799 -102 | 6,129 7 |
| 2019-20 | 49,809 -542 | 39,176 -247 | 19,352 -86 | 19,824 -161 | 10,633 -295 | 4,575 -224 | 6,058 -71 |
| 2020-21 | 49,695 -114 | 38,491 -685 | 18,731 -621 | 19,760 -64 | 11,204 571 | 4,819 244 | 6,385 327 |
| 2021-22 | 49,659 -36 | 38,574 83 | 18,668 -63 | 19,906 146 | 11,085 -119 | 4,698 -121 | 6,387 2 |
| 2022-23 | 50,023 364 | 39,201 627 | 18,944 276 | 20,257 351 | 10,822 -263 | 4,597 -101 | 6,225 -162 |
| Average | 49,874 | 38,747 | 19,095 | 19,653 | 11,127 | 4,854 | 6,272 |