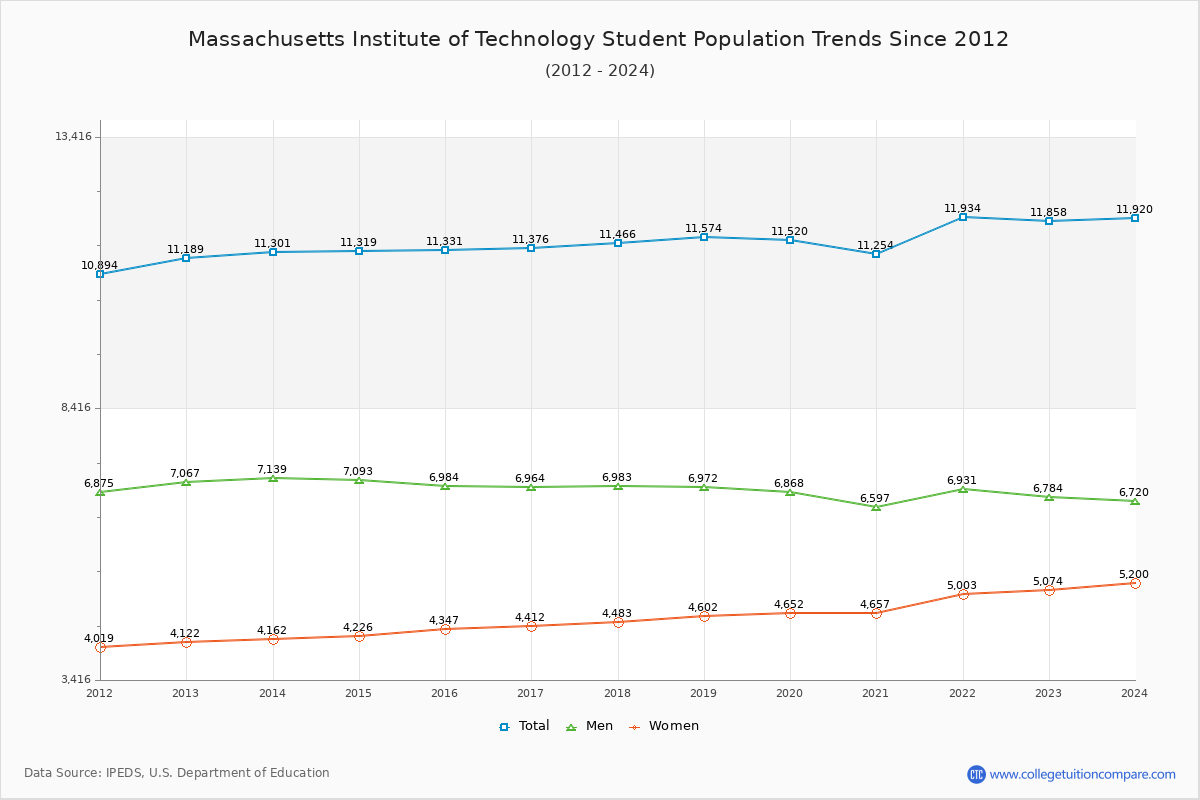
Student Population Changes
The average student population over the last 12 years is 11,466 where 11,858 students are attending the school for the academic year 2022-2023.
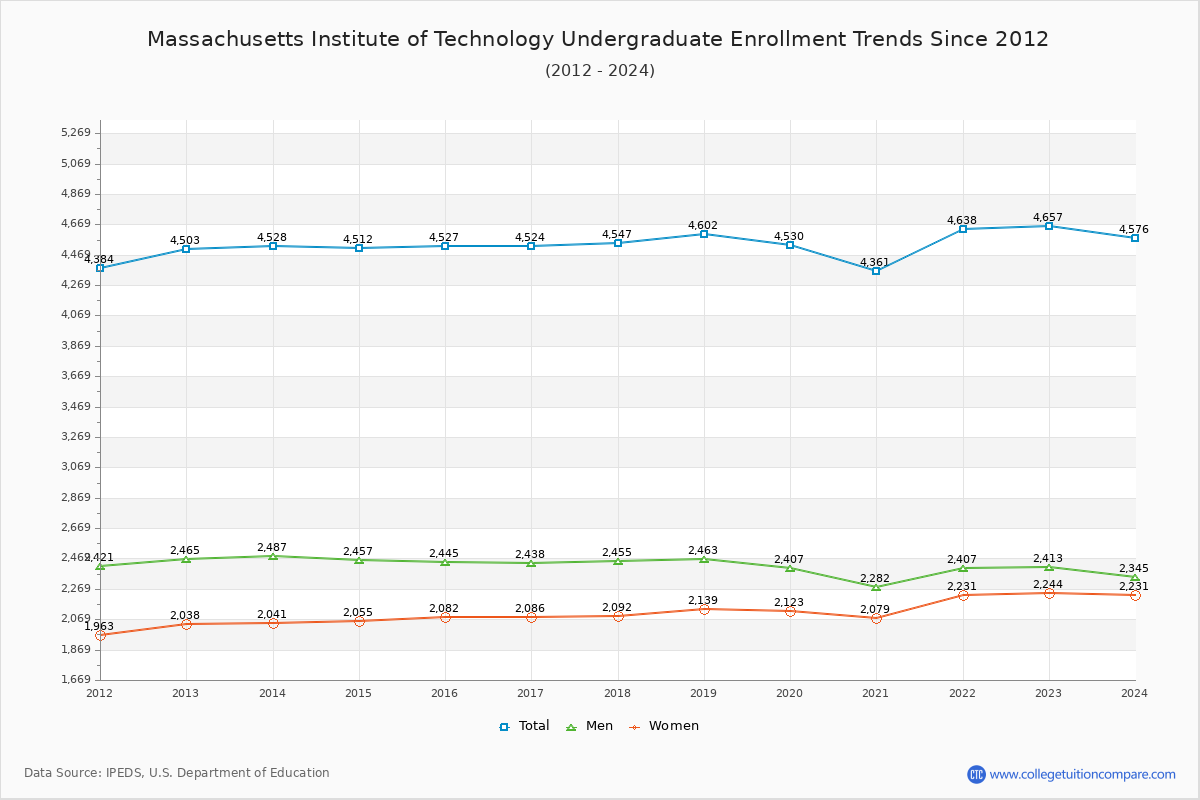
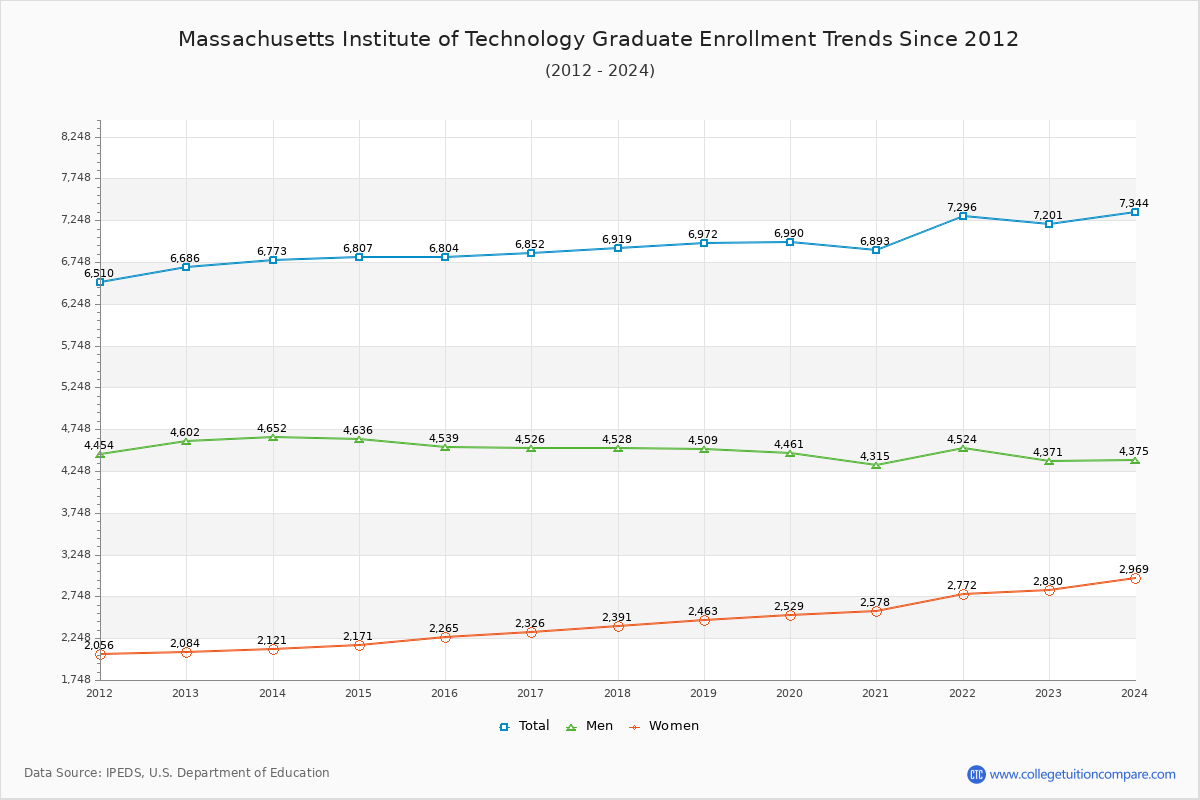
39.27% of total students is undergraduate students and 60.73% students is graduate students. The number of undergraduate students has increased by 154 and the graduate enrollment has increased by 515 over past 10 years.
The female to male ratio is 0.75 to 1 and it means that there are more male students enrolled in MIT than female students.
The following table and chart illustrate the changes in student population by gender at Massachusetts Institute of Technology since 2012.
| Year | Total | Undergraduate | Graduate | ||||
|---|---|---|---|---|---|---|---|
| Total | Men | Women | Total | Men | Women | ||
| 2012-13 | 11,189 | 4,503 | 2,465 | 2,038 | 6,686 | 4,602 | 2,084 |
| 2013-14 | 11,301 112 | 4,528 25 | 2,487 22 | 2,041 3 | 6,773 87 | 4,652 50 | 2,121 37 |
| 2014-15 | 11,319 18 | 4,512 -16 | 2,457 -30 | 2,055 14 | 6,807 34 | 4,636 -16 | 2,171 50 |
| 2015-16 | 11,331 12 | 4,527 15 | 2,445 -12 | 2,082 27 | 6,804 -3 | 4,539 -97 | 2,265 94 |
| 2016-17 | 11,376 45 | 4,524 -3 | 2,438 -7 | 2,086 4 | 6,852 48 | 4,526 -13 | 2,326 61 |
| 2017-18 | 11,466 90 | 4,547 23 | 2,455 17 | 2,092 6 | 6,919 67 | 4,528 2 | 2,391 65 |
| 2018-19 | 11,574 108 | 4,602 55 | 2,463 8 | 2,139 47 | 6,972 53 | 4,509 -19 | 2,463 72 |
| 2019-20 | 11,520 -54 | 4,530 -72 | 2,407 -56 | 2,123 -16 | 6,990 18 | 4,461 -48 | 2,529 66 |
| 2020-21 | 11,254 -266 | 4,361 -169 | 2,282 -125 | 2,079 -44 | 6,893 -97 | 4,315 -146 | 2,578 49 |
| 2021-22 | 11,934 680 | 4,638 277 | 2,407 125 | 2,231 152 | 7,296 403 | 4,524 209 | 2,772 194 |
| 2022-23 | 11,858 -76 | 4,657 19 | 2,413 6 | 2,244 13 | 7,201 -95 | 4,371 -153 | 2,830 58 |
| Average | 11,466 | 4,539 | 2,429 | 2,110 | 6,927 | 4,515 | 2,412 |