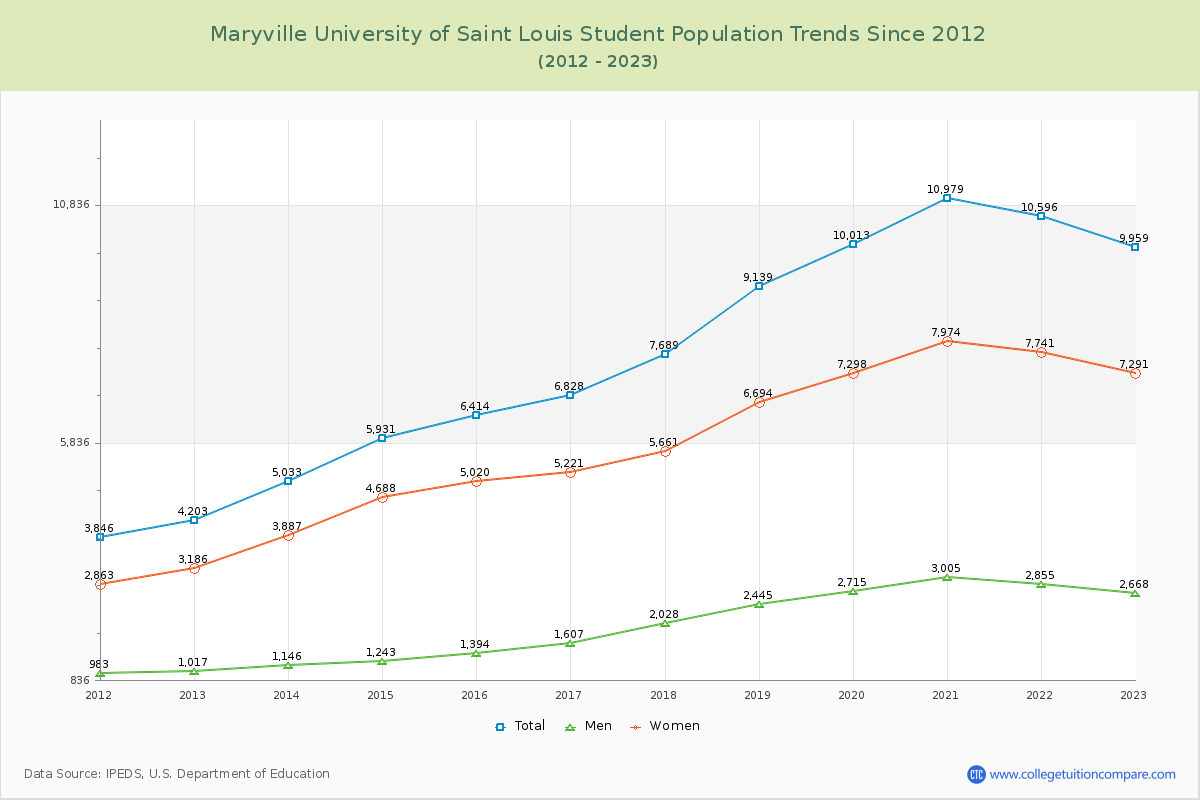
Student Population Changes
The average student population over the last 12 years is 7,889 where 9,959 students are attending the school for the academic year 2022-2023.
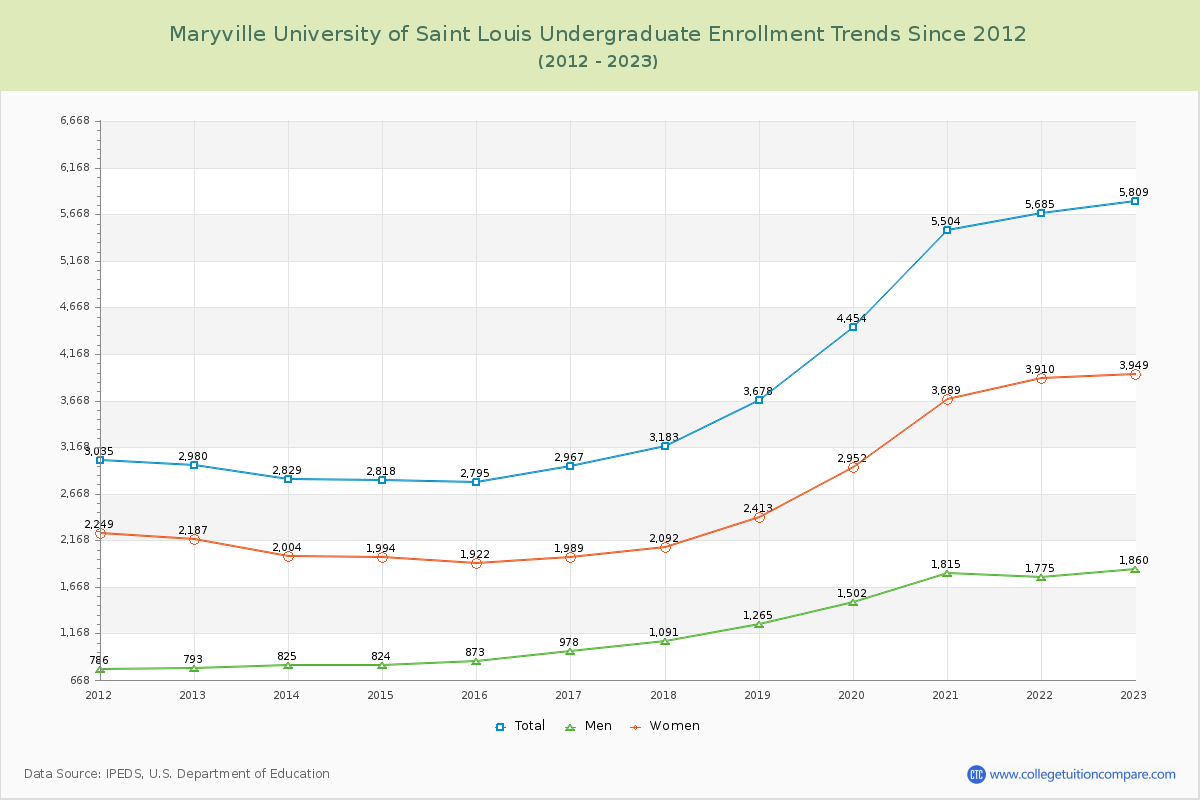
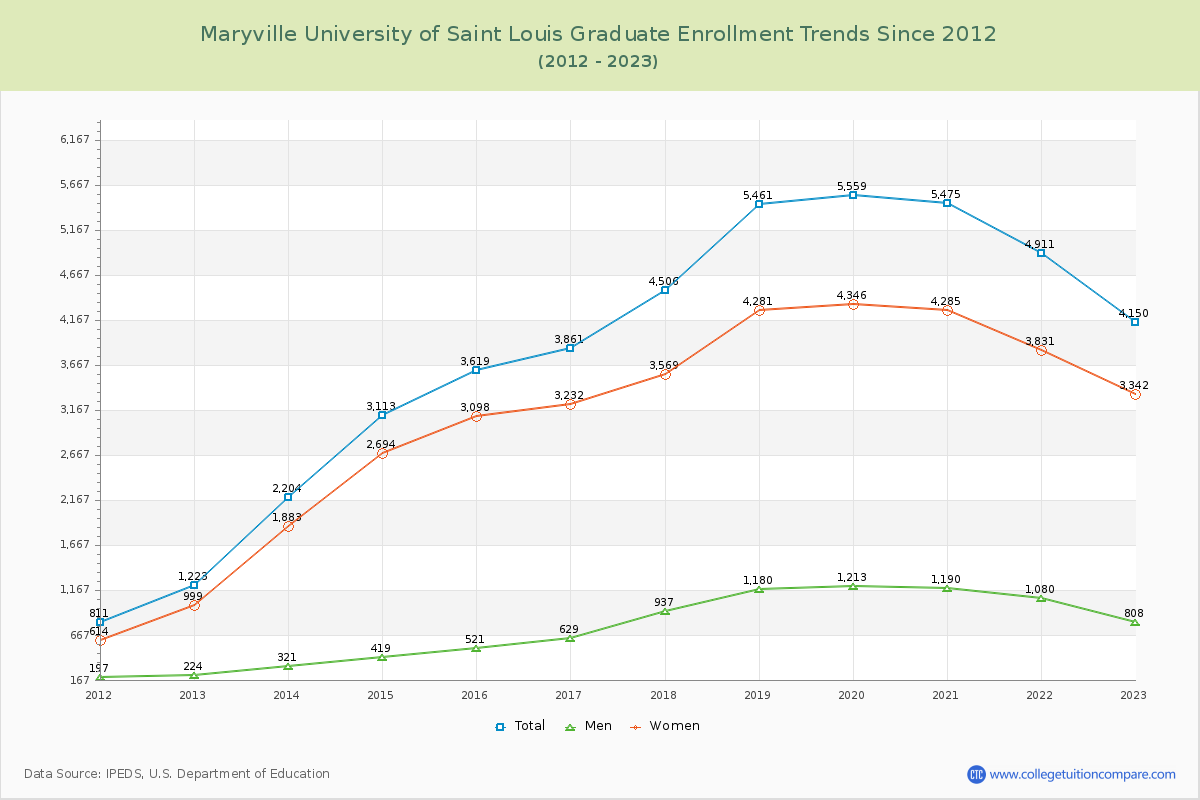
58.33% of total students is undergraduate students and 41.67% students is graduate students. The number of undergraduate students has increased by 2,829 and the graduate enrollment has increased by 2,927 over past 10 years.
The female to male ratio is 2.73 to 1 and it means that there are far more female students enrolled in Maryville University of Saint Louis than male students.
The following table and chart illustrate the changes in student population by gender at Maryville University of Saint Louis since 2012.
| Year | Total | Undergraduate | Graduate | ||||
|---|---|---|---|---|---|---|---|
| Total | Men | Women | Total | Men | Women | ||
| 2012-13 | 4,203 | 2,980 | 793 | 2,187 | 1,223 | 224 | 999 |
| 2013-14 | 5,033 830 | 2,829 -151 | 825 32 | 2,004 -183 | 2,204 981 | 321 97 | 1,883 884 |
| 2014-15 | 5,931 898 | 2,818 -11 | 824 -1 | 1,994 -10 | 3,113 909 | 419 98 | 2,694 811 |
| 2015-16 | 6,414 483 | 2,795 -23 | 873 49 | 1,922 -72 | 3,619 506 | 521 102 | 3,098 404 |
| 2016-17 | 6,828 414 | 2,967 172 | 978 105 | 1,989 67 | 3,861 242 | 629 108 | 3,232 134 |
| 2017-18 | 7,689 861 | 3,183 216 | 1,091 113 | 2,092 103 | 4,506 645 | 937 308 | 3,569 337 |
| 2018-19 | 9,139 1,450 | 3,678 495 | 1,265 174 | 2,413 321 | 5,461 955 | 1,180 243 | 4,281 712 |
| 2019-20 | 10,013 874 | 4,454 776 | 1,502 237 | 2,952 539 | 5,559 98 | 1,213 33 | 4,346 65 |
| 2020-21 | 10,979 966 | 5,504 1,050 | 1,815 313 | 3,689 737 | 5,475 -84 | 1,190 -23 | 4,285 -61 |
| 2021-22 | 10,596 -383 | 5,685 181 | 1,775 -40 | 3,910 221 | 4,911 -564 | 1,080 -110 | 3,831 -454 |
| 2022-23 | 9,959 -637 | 5,809 124 | 1,860 85 | 3,949 39 | 4,150 -761 | 808 -272 | 3,342 -489 |
| Average | 7,889 | 3,882 | 1,236 | 2,646 | 4,007 | 775 | 3,233 |