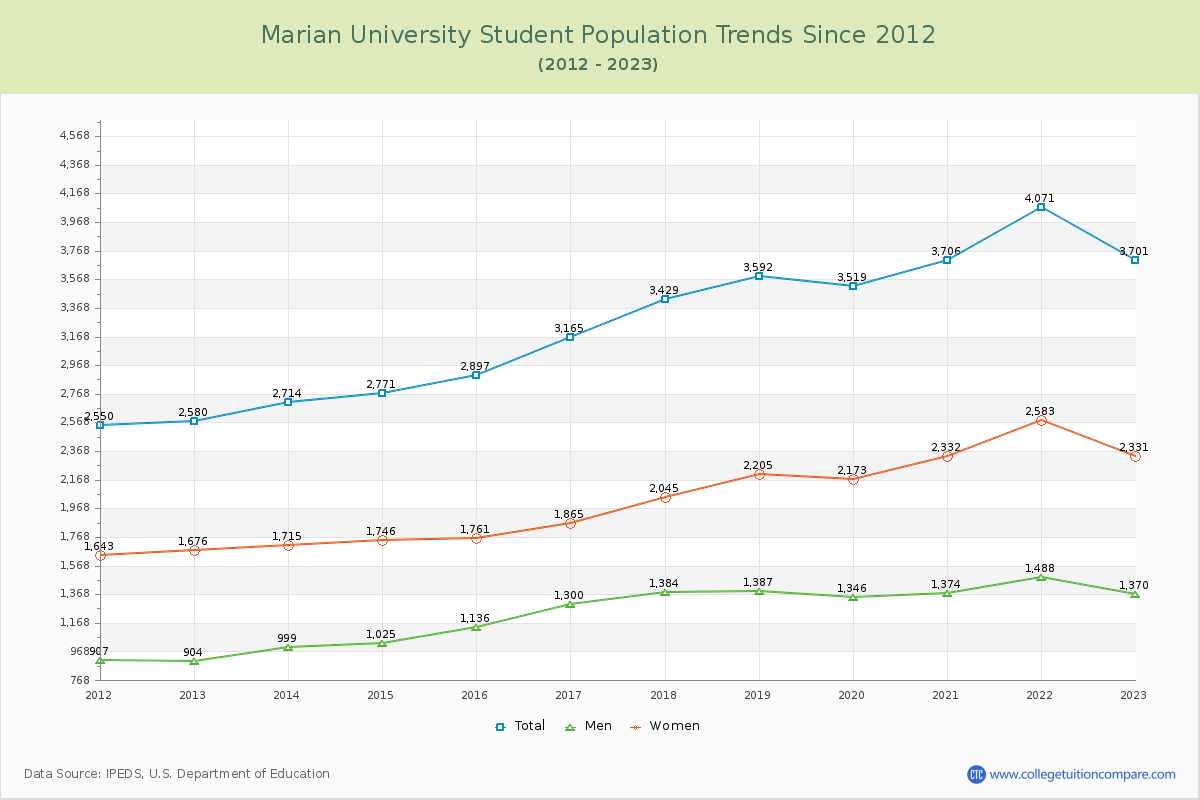
Student Population Changes
The average student population over the last 12 years is 3,286 where 3,701 students are attending the school for the academic year 2022-2023.
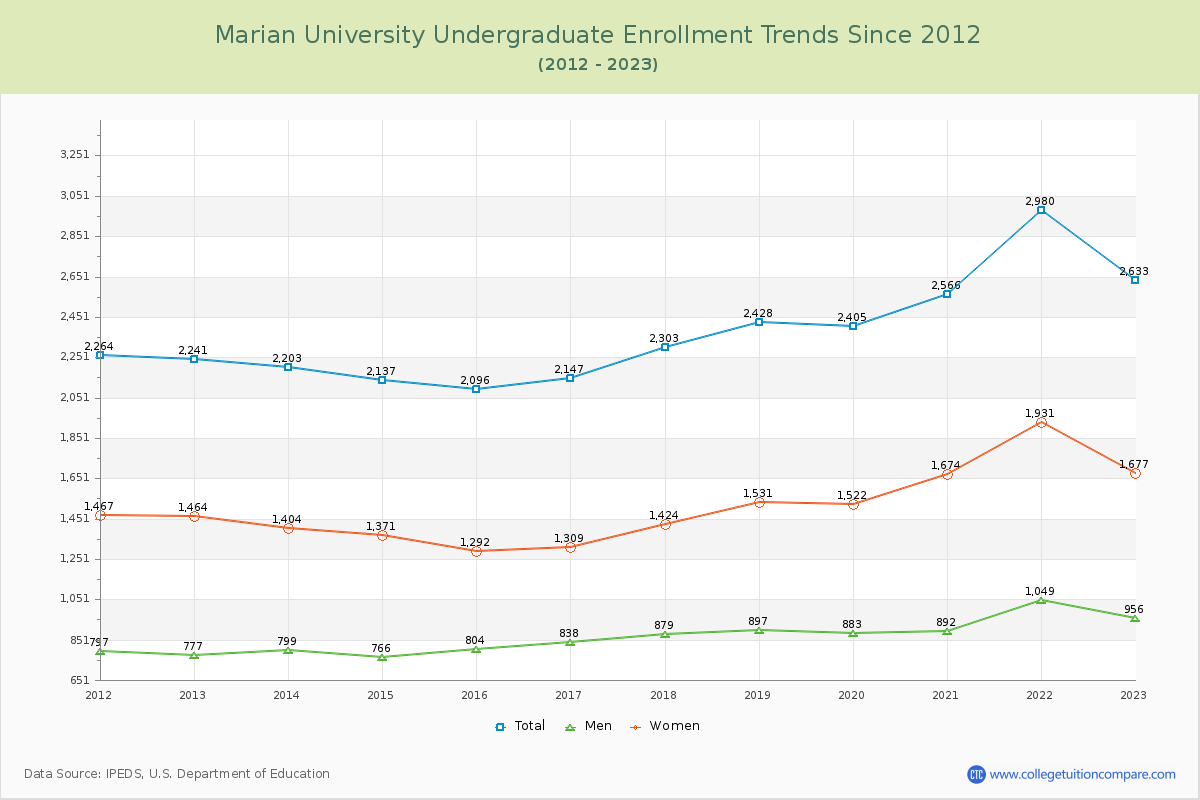
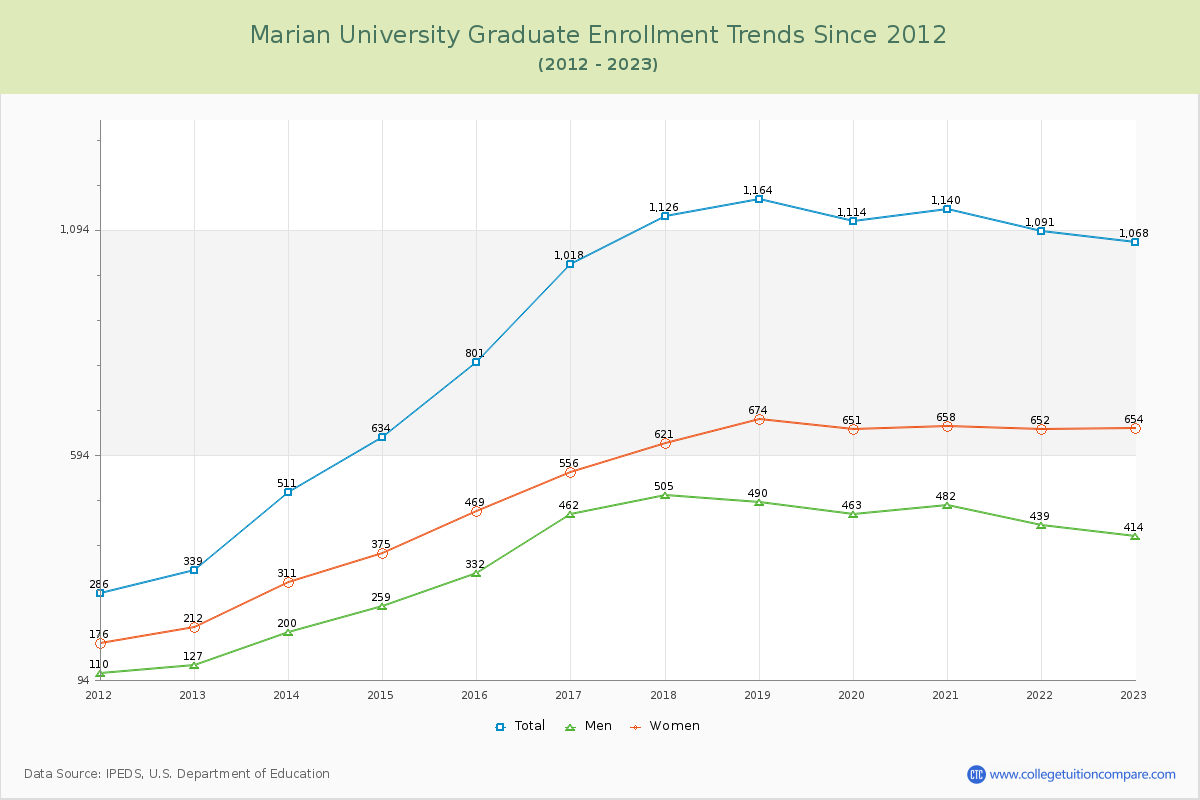
71.14% of total students is undergraduate students and 28.86% students is graduate students. The number of undergraduate students has increased by 392 and the graduate enrollment has increased by 729 over past 10 years.
The female to male ratio is 1.70 to 1 and it means that there are more female students enrolled in Marian than male students.
The following table and chart illustrate the changes in student population by gender at Marian University since 2012.
| Year | Total | Undergraduate | Graduate | ||||
|---|---|---|---|---|---|---|---|
| Total | Men | Women | Total | Men | Women | ||
| 2012-13 | 2,580 | 2,241 | 777 | 1,464 | 339 | 127 | 212 |
| 2013-14 | 2,714 134 | 2,203 -38 | 799 22 | 1,404 -60 | 511 172 | 200 73 | 311 99 |
| 2014-15 | 2,771 57 | 2,137 -66 | 766 -33 | 1,371 -33 | 634 123 | 259 59 | 375 64 |
| 2015-16 | 2,897 126 | 2,096 -41 | 804 38 | 1,292 -79 | 801 167 | 332 73 | 469 94 |
| 2016-17 | 3,165 268 | 2,147 51 | 838 34 | 1,309 17 | 1,018 217 | 462 130 | 556 87 |
| 2017-18 | 3,429 264 | 2,303 156 | 879 41 | 1,424 115 | 1,126 108 | 505 43 | 621 65 |
| 2018-19 | 3,592 163 | 2,428 125 | 897 18 | 1,531 107 | 1,164 38 | 490 -15 | 674 53 |
| 2019-20 | 3,519 -73 | 2,405 -23 | 883 -14 | 1,522 -9 | 1,114 -50 | 463 -27 | 651 -23 |
| 2020-21 | 3,706 187 | 2,566 161 | 892 9 | 1,674 152 | 1,140 26 | 482 19 | 658 7 |
| 2021-22 | 4,071 365 | 2,980 414 | 1,049 157 | 1,931 257 | 1,091 -49 | 439 -43 | 652 -6 |
| 2022-23 | 3,701 -370 | 2,633 -347 | 956 -93 | 1,677 -254 | 1,068 -23 | 414 -25 | 654 2 |
| Average | 3,286 | 2,376 | 867 | 1,509 | 910 | 379 | 530 |