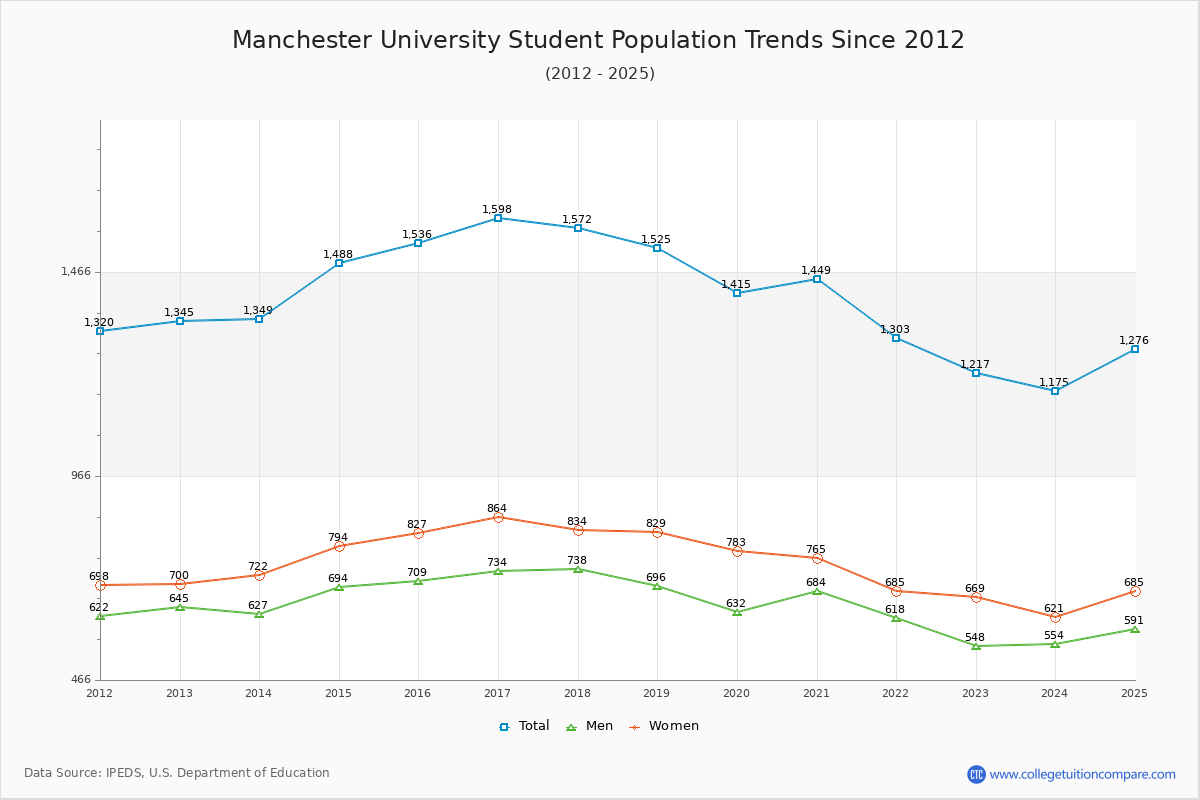
Student Population Changes
The average student population over the last 12 years is 1,436 where 1,217 students are attending the school for the academic year 2022-2023.
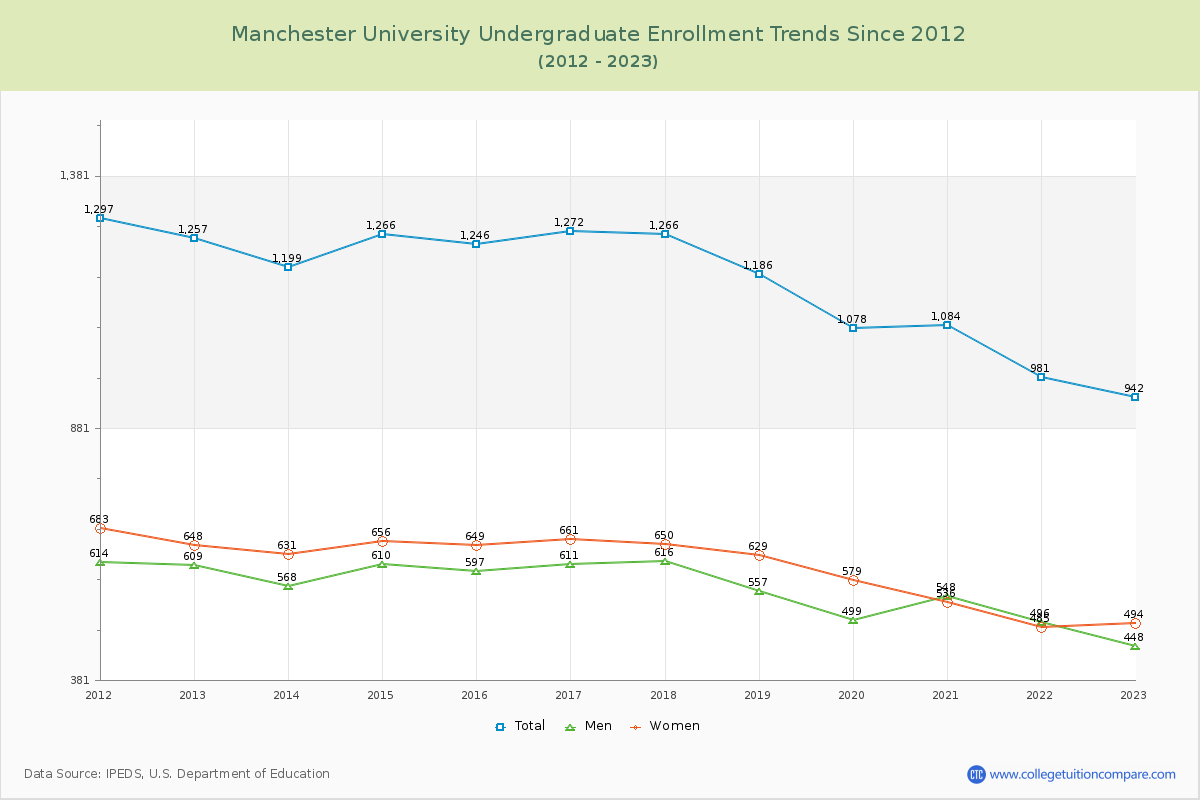
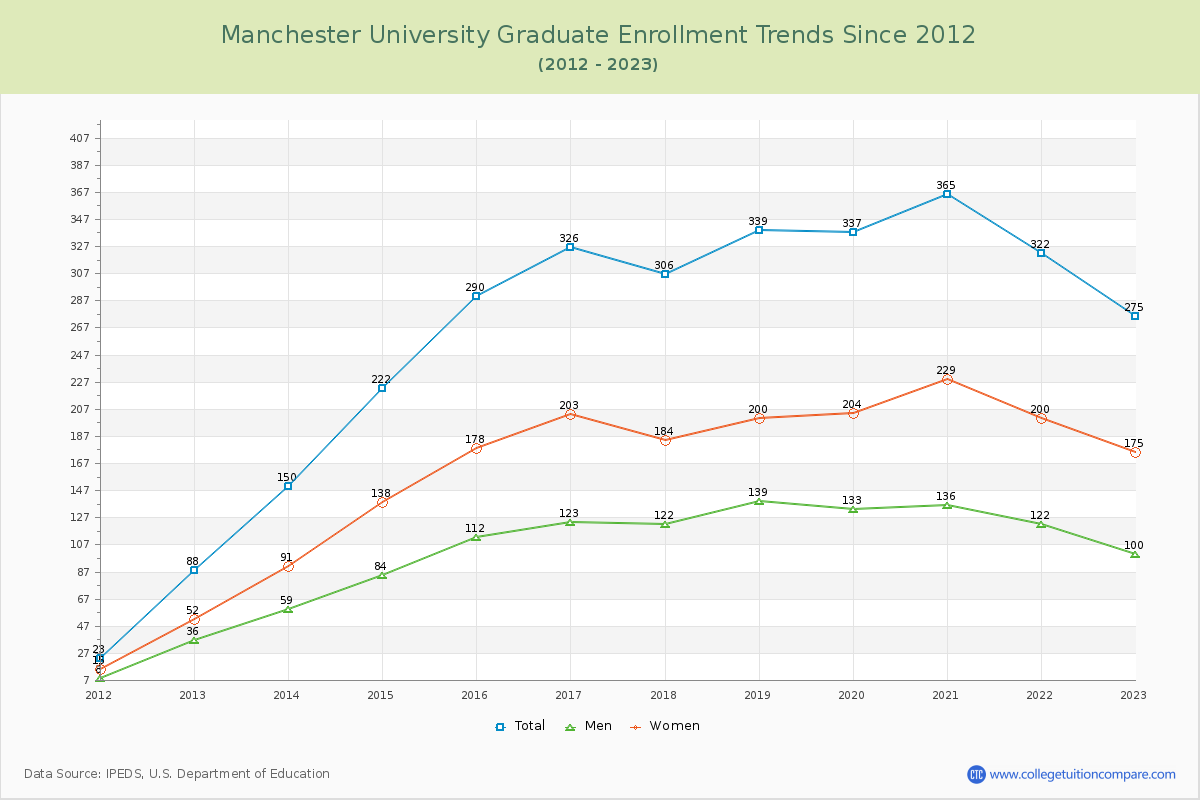
77.40% of total students is undergraduate students and 22.60% students is graduate students. The number of undergraduate students has decreased by 315 and the graduate enrollment has increased by 187 over past 10 years.
The female to male ratio is 1.22 to 1 and it means that there are slightly more female students enrolled in Manchester than male students.
The following table and chart illustrate the changes in student population by gender at Manchester University since 2012.
| Year | Total | Undergraduate | Graduate | ||||
|---|---|---|---|---|---|---|---|
| Total | Men | Women | Total | Men | Women | ||
| 2012-13 | 1,345 | 1,257 | 609 | 648 | 88 | 36 | 52 |
| 2013-14 | 1,349 4 | 1,199 -58 | 568 -41 | 631 -17 | 150 62 | 59 23 | 91 39 |
| 2014-15 | 1,488 139 | 1,266 67 | 610 42 | 656 25 | 222 72 | 84 25 | 138 47 |
| 2015-16 | 1,536 48 | 1,246 -20 | 597 -13 | 649 -7 | 290 68 | 112 28 | 178 40 |
| 2016-17 | 1,598 62 | 1,272 26 | 611 14 | 661 12 | 326 36 | 123 11 | 203 25 |
| 2017-18 | 1,572 -26 | 1,266 -6 | 616 5 | 650 -11 | 306 -20 | 122 -1 | 184 -19 |
| 2018-19 | 1,525 -47 | 1,186 -80 | 557 -59 | 629 -21 | 339 33 | 139 17 | 200 16 |
| 2019-20 | 1,415 -110 | 1,078 -108 | 499 -58 | 579 -50 | 337 -2 | 133 -6 | 204 4 |
| 2020-21 | 1,449 34 | 1,084 6 | 548 49 | 536 -43 | 365 28 | 136 3 | 229 25 |
| 2021-22 | 1,303 -146 | 981 -103 | 496 -52 | 485 -51 | 322 -43 | 122 -14 | 200 -29 |
| 2022-23 | 1,217 -86 | 942 -39 | 448 -48 | 494 9 | 275 -47 | 100 -22 | 175 -25 |
| Average | 1,436 | 1,162 | 560 | 602 | 275 | 106 | 169 |