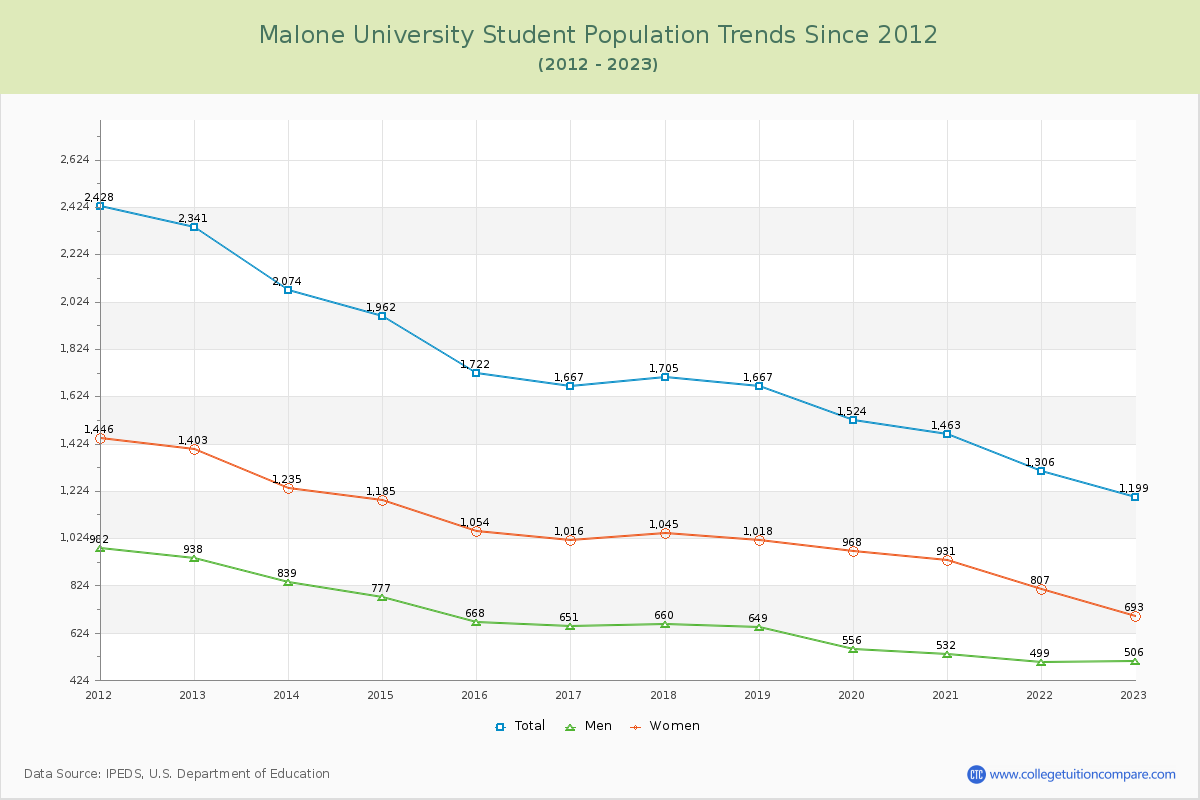
Student Population Changes
The average student population over the last 12 years is 1,694 where 1,199 students are attending the school for the academic year 2022-2023.
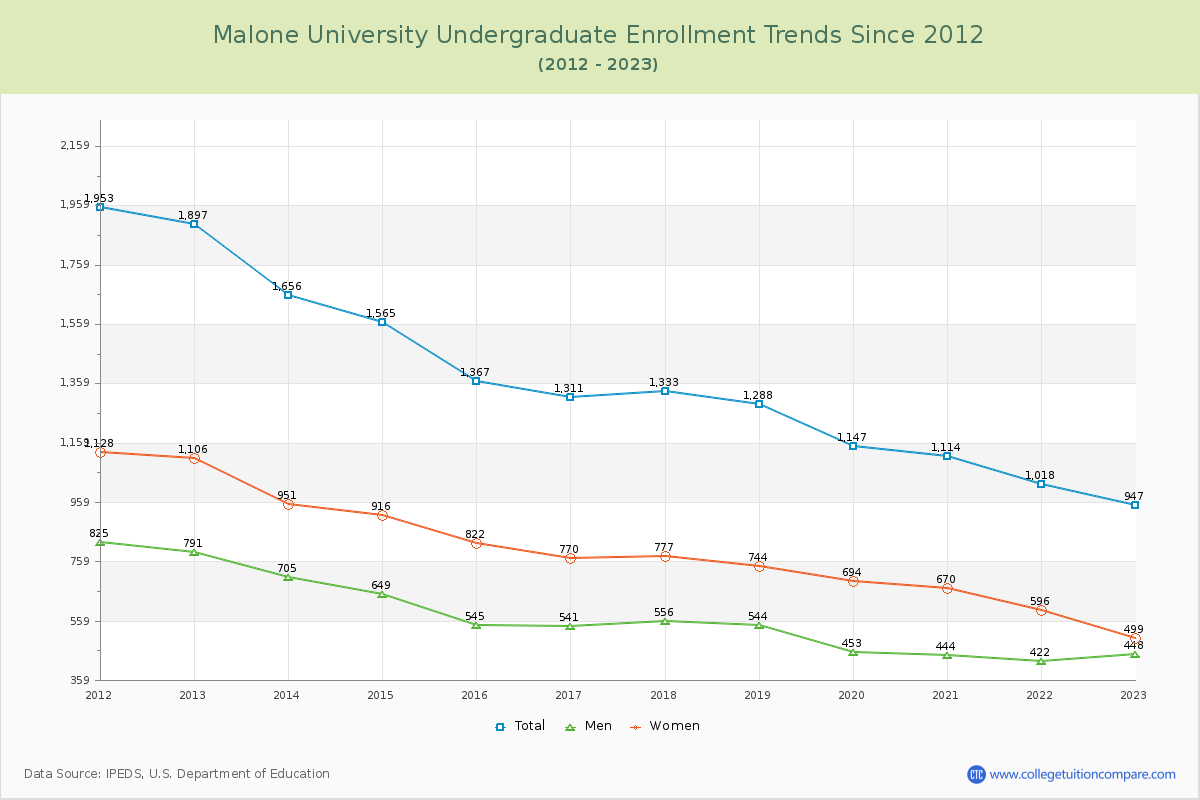
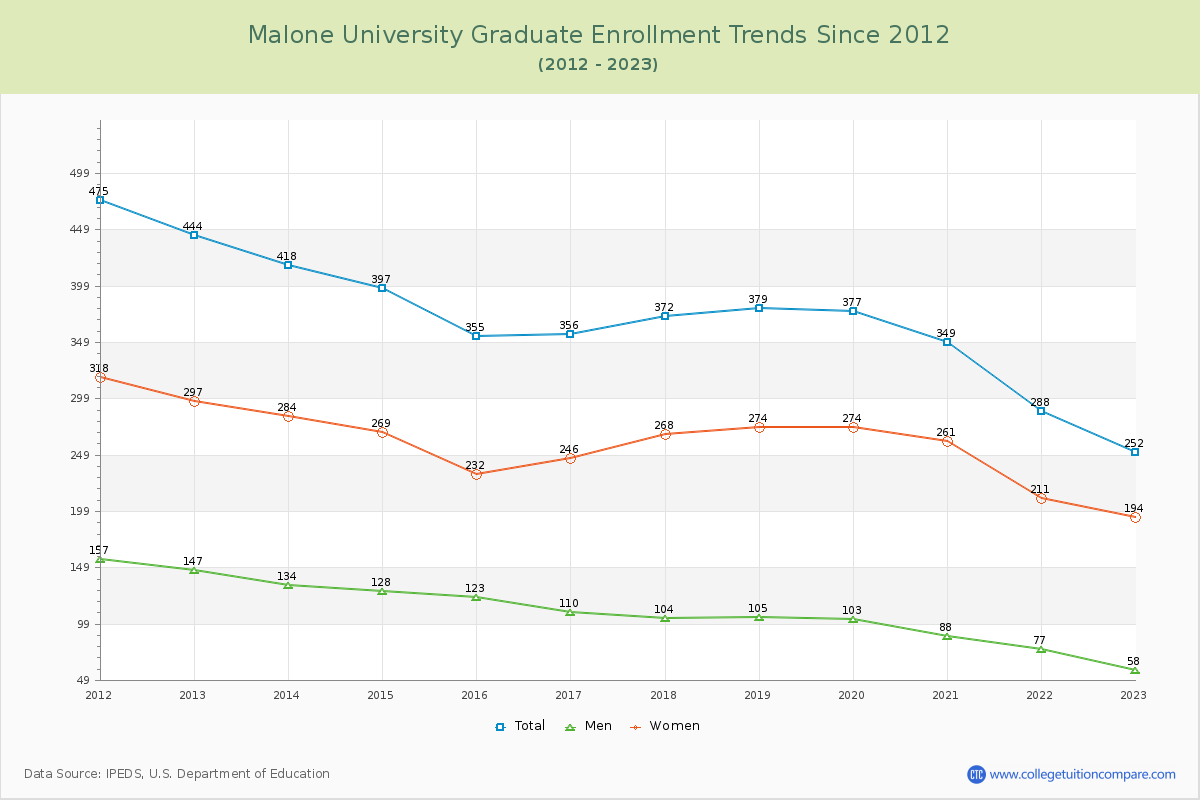
78.98% of total students is undergraduate students and 21.02% students is graduate students. The number of undergraduate students has decreased by 950 and the graduate enrollment has decreased by 192 over past 10 years.
The female to male ratio is 1.37 to 1 and it means that there are more female students enrolled in Malone than male students.
The following table and chart illustrate the changes in student population by gender at Malone University since 2012.
| Year | Total | Undergraduate | Graduate | ||||
|---|---|---|---|---|---|---|---|
| Total | Men | Women | Total | Men | Women | ||
| 2012-13 | 2,341 | 1,897 | 791 | 1,106 | 444 | 147 | 297 |
| 2013-14 | 2,074 -267 | 1,656 -241 | 705 -86 | 951 -155 | 418 -26 | 134 -13 | 284 -13 |
| 2014-15 | 1,962 -112 | 1,565 -91 | 649 -56 | 916 -35 | 397 -21 | 128 -6 | 269 -15 |
| 2015-16 | 1,722 -240 | 1,367 -198 | 545 -104 | 822 -94 | 355 -42 | 123 -5 | 232 -37 |
| 2016-17 | 1,667 -55 | 1,311 -56 | 541 -4 | 770 -52 | 356 1 | 110 -13 | 246 14 |
| 2017-18 | 1,705 38 | 1,333 22 | 556 15 | 777 7 | 372 16 | 104 -6 | 268 22 |
| 2018-19 | 1,667 -38 | 1,288 -45 | 544 -12 | 744 -33 | 379 7 | 105 1 | 274 6 |
| 2019-20 | 1,524 -143 | 1,147 -141 | 453 -91 | 694 -50 | 377 -2 | 103 -2 | 274 0 |
| 2020-21 | 1,463 -61 | 1,114 -33 | 444 -9 | 670 -24 | 349 -28 | 88 -15 | 261 -13 |
| 2021-22 | 1,306 -157 | 1,018 -96 | 422 -22 | 596 -74 | 288 -61 | 77 -11 | 211 -50 |
| 2022-23 | 1,199 -107 | 947 -71 | 448 26 | 499 -97 | 252 -36 | 58 -19 | 194 -17 |
| Average | 1,694 | 1,331 | 554 | 777 | 362 | 107 | 255 |