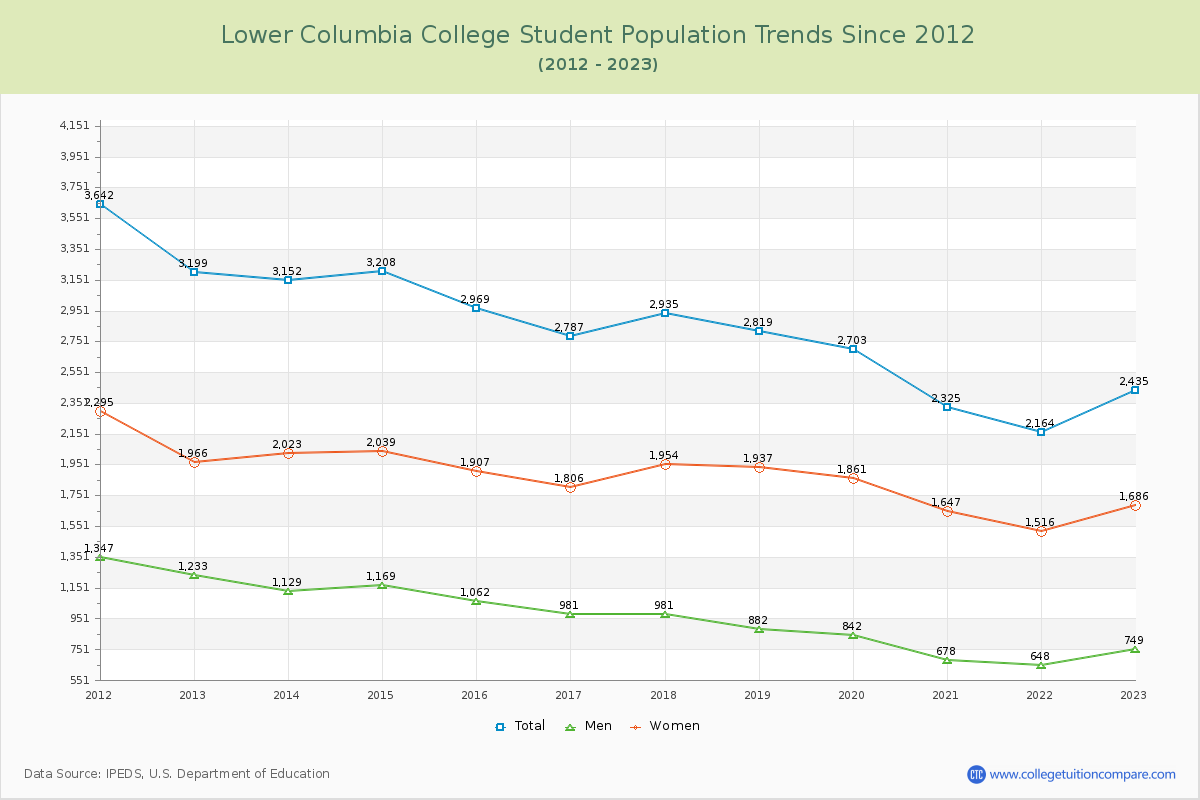
Student Population Changes
The average student population over the last 12 years is 2,791 where 2,435 students are attending the school for the academic year 2022-2023.
The female to male ratio is 2.25 to 1 and it means that there are far more female students enrolled in LCC than male students.
The following table and chart illustrate the changes in student population by gender at Lower Columbia College since 2012.
| Year | Total | Men | Women |
|---|---|---|---|
| 2012-13 | 3,199 | 1,233 | 1,966 |
| 2013-14 | 3,152 -47 | 1,129 -104 | 2,023 57 |
| 2014-15 | 3,208 56 | 1,169 40 | 2,039 16 |
| 2015-16 | 2,969 -239 | 1,062 -107 | 1,907 -132 |
| 2016-17 | 2,787 -182 | 981 -81 | 1,806 -101 |
| 2017-18 | 2,935 148 | 981 0 | 1,954 148 |
| 2018-19 | 2,819 -116 | 882 -99 | 1,937 -17 |
| 2019-20 | 2,703 -116 | 842 -40 | 1,861 -76 |
| 2020-21 | 2,325 -378 | 678 -164 | 1,647 -214 |
| 2021-22 | 2,164 -161 | 648 -30 | 1,516 -131 |
| 2022-23 | 2,435 271 | 749 101 | 1,686 170 |
| Average | 2,791 | 941 | 1,849 |