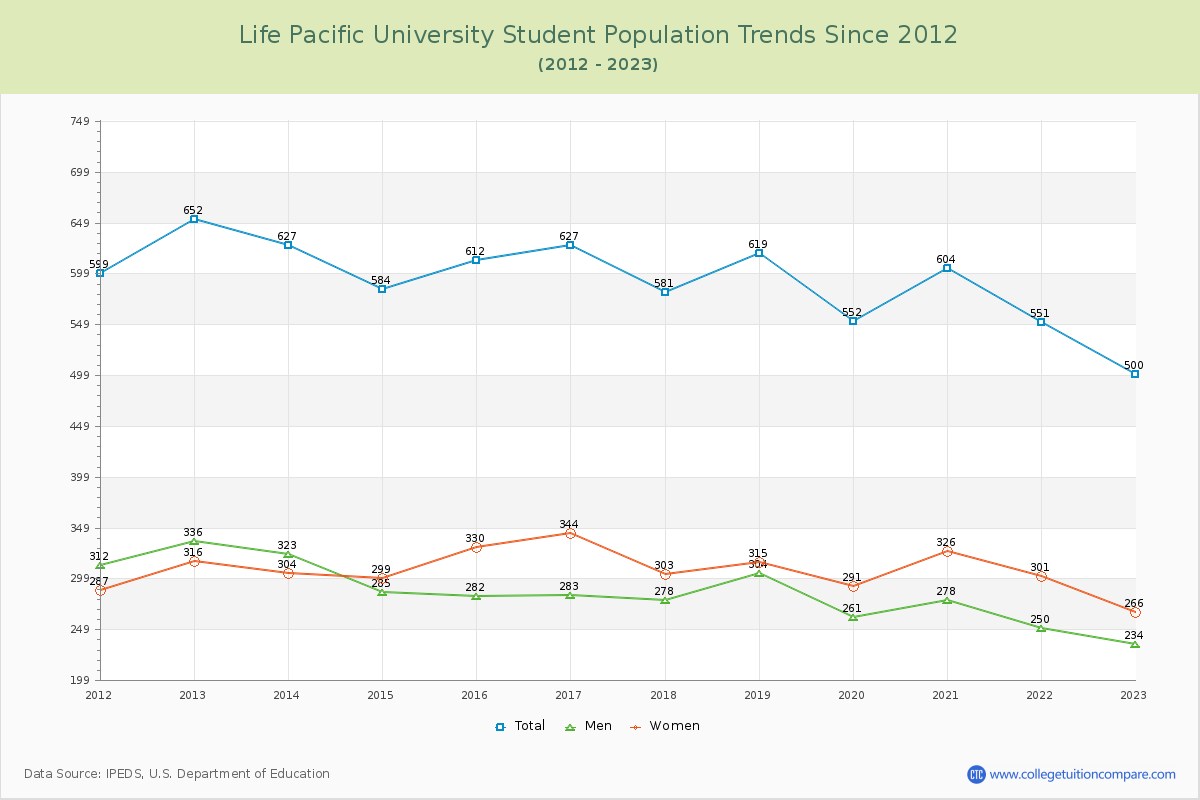
Student Population Changes
The average student population over the last 12 years is 592 where 500 students are attending the school for the academic year 2022-2023.
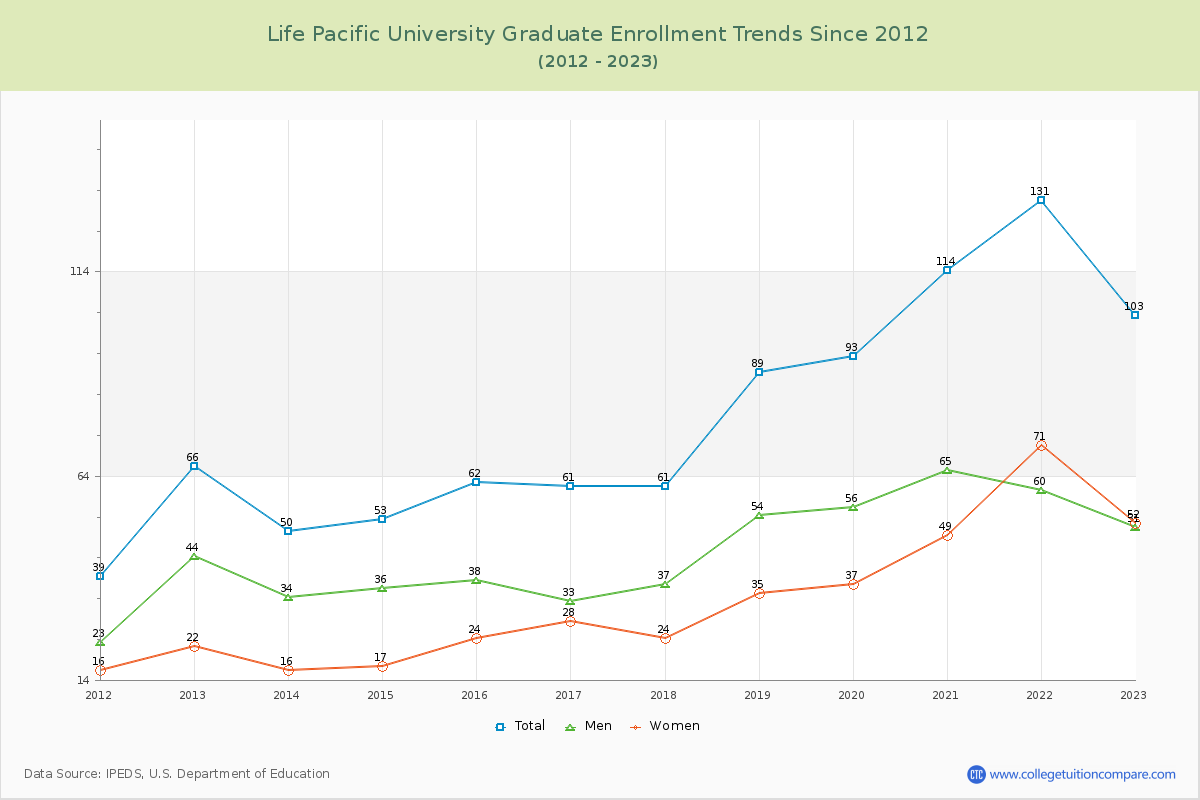
79.40% of total students is undergraduate students and 20.60% students is graduate students. The number of undergraduate students has decreased by 189 and the graduate enrollment has increased by 37 over past 10 years.
The female to male ratio is 1.14 to 1 and it means that there are slightly more female students enrolled in LPU than male students.
The following table and chart illustrate the changes in student population by gender at Life Pacific University since 2012.
| Year | Total | Undergraduate | Graduate | ||||
|---|---|---|---|---|---|---|---|
| Total | Men | Women | Total | Men | Women | ||
| 2012-13 | 652 | 586 | 292 | 294 | 66 | 44 | 22 |
| 2013-14 | 627 -25 | 577 -9 | 289 -3 | 288 -6 | 50 -16 | 34 -10 | 16 -6 |
| 2014-15 | 584 -43 | 531 -46 | 249 -40 | 282 -6 | 53 3 | 36 2 | 17 1 |
| 2015-16 | 612 28 | 550 19 | 244 -5 | 306 24 | 62 9 | 38 2 | 24 7 |
| 2016-17 | 627 15 | 566 16 | 250 6 | 316 10 | 61 -1 | 33 -5 | 28 4 |
| 2017-18 | 581 -46 | 520 -46 | 241 -9 | 279 -37 | 61 0 | 37 4 | 24 -4 |
| 2018-19 | 619 38 | 530 10 | 250 9 | 280 1 | 89 28 | 54 17 | 35 11 |
| 2019-20 | 552 -67 | 459 -71 | 205 -45 | 254 -26 | 93 4 | 56 2 | 37 2 |
| 2020-21 | 604 52 | 490 31 | 213 8 | 277 23 | 114 21 | 65 9 | 49 12 |
| 2021-22 | 551 -53 | 420 -70 | 190 -23 | 230 -47 | 131 17 | 60 -5 | 71 22 |
| 2022-23 | 500 -51 | 397 -23 | 183 -7 | 214 -16 | 103 -28 | 51 -9 | 52 -19 |
| Average | 592 | 511 | 237 | 275 | 80 | 46 | 34 |