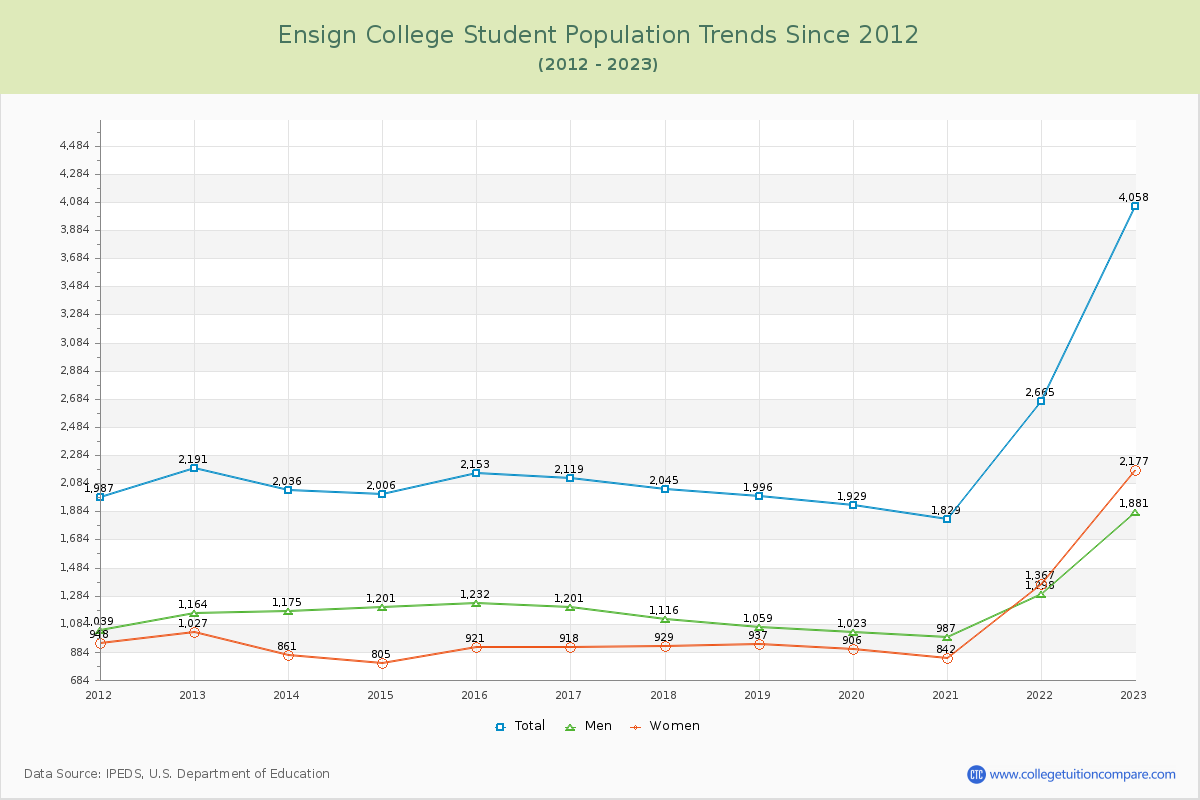
Student Population Changes
The average student population over the last 12 years is 2,275 where 4,058 students are attending the school for the academic year 2022-2023.
The female to male ratio is 1.16 to 1 and it means that there are slightly more female students enrolled in Ensign than male students.
The following table and chart illustrate the changes in student population by gender at Ensign College since 2012.
| Year | Total | Men | Women |
|---|---|---|---|
| 2012-13 | 2,191 | 1,164 | 1,027 |
| 2013-14 | 2,036 -155 | 1,175 11 | 861 -166 |
| 2014-15 | 2,006 -30 | 1,201 26 | 805 -56 |
| 2015-16 | 2,153 147 | 1,232 31 | 921 116 |
| 2016-17 | 2,119 -34 | 1,201 -31 | 918 -3 |
| 2017-18 | 2,045 -74 | 1,116 -85 | 929 11 |
| 2018-19 | 1,996 -49 | 1,059 -57 | 937 8 |
| 2019-20 | 1,929 -67 | 1,023 -36 | 906 -31 |
| 2020-21 | 1,829 -100 | 987 -36 | 842 -64 |
| 2021-22 | 2,665 836 | 1,298 311 | 1,367 525 |
| 2022-23 | 4,058 1,393 | 1,881 583 | 2,177 810 |
| Average | 2,275 | 1,212 | 1,063 |