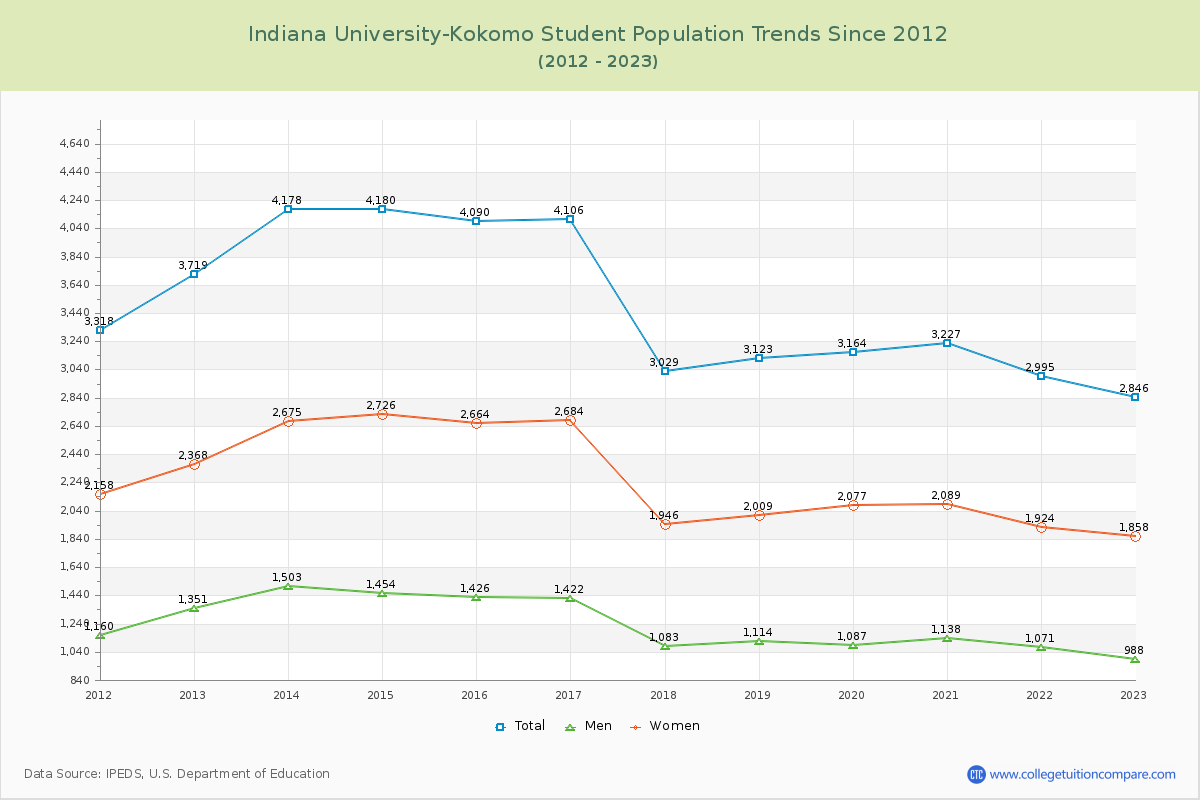
Student Population Changes
The average student population over the last 12 years is 3,514 where 2,846 students are attending the school for the academic year 2022-2023.
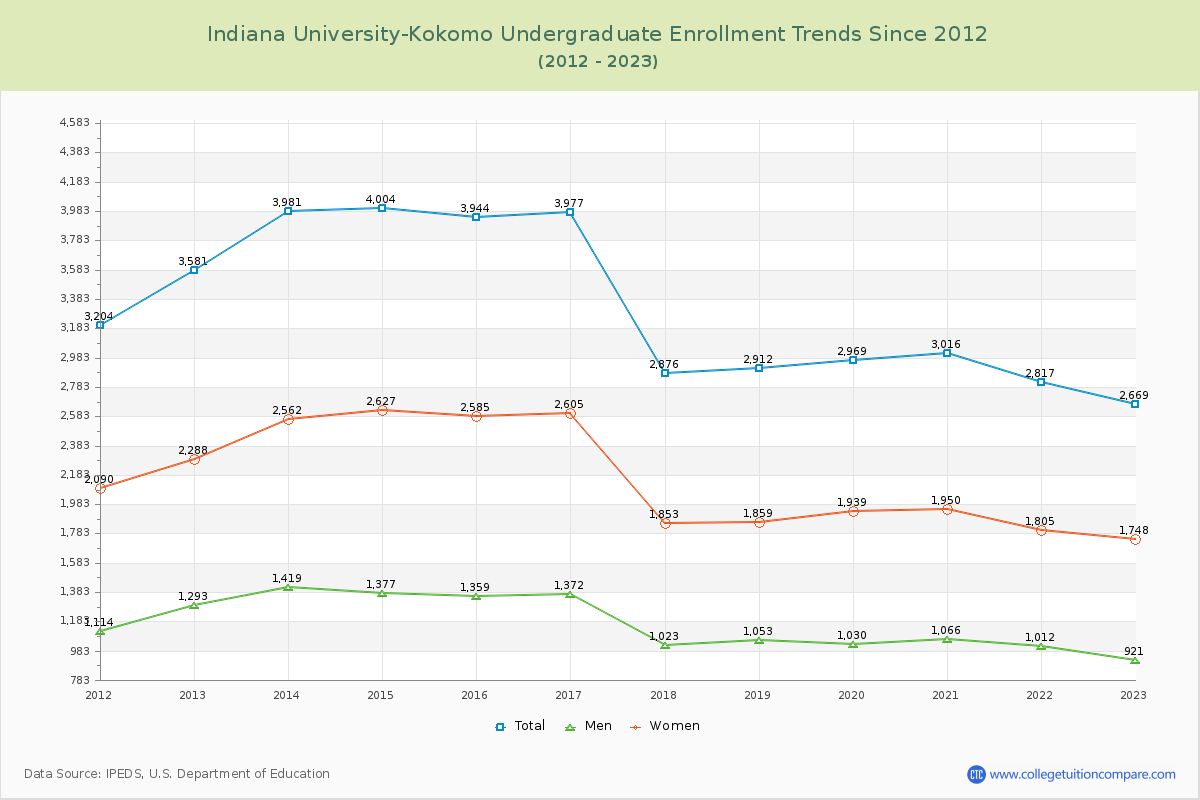
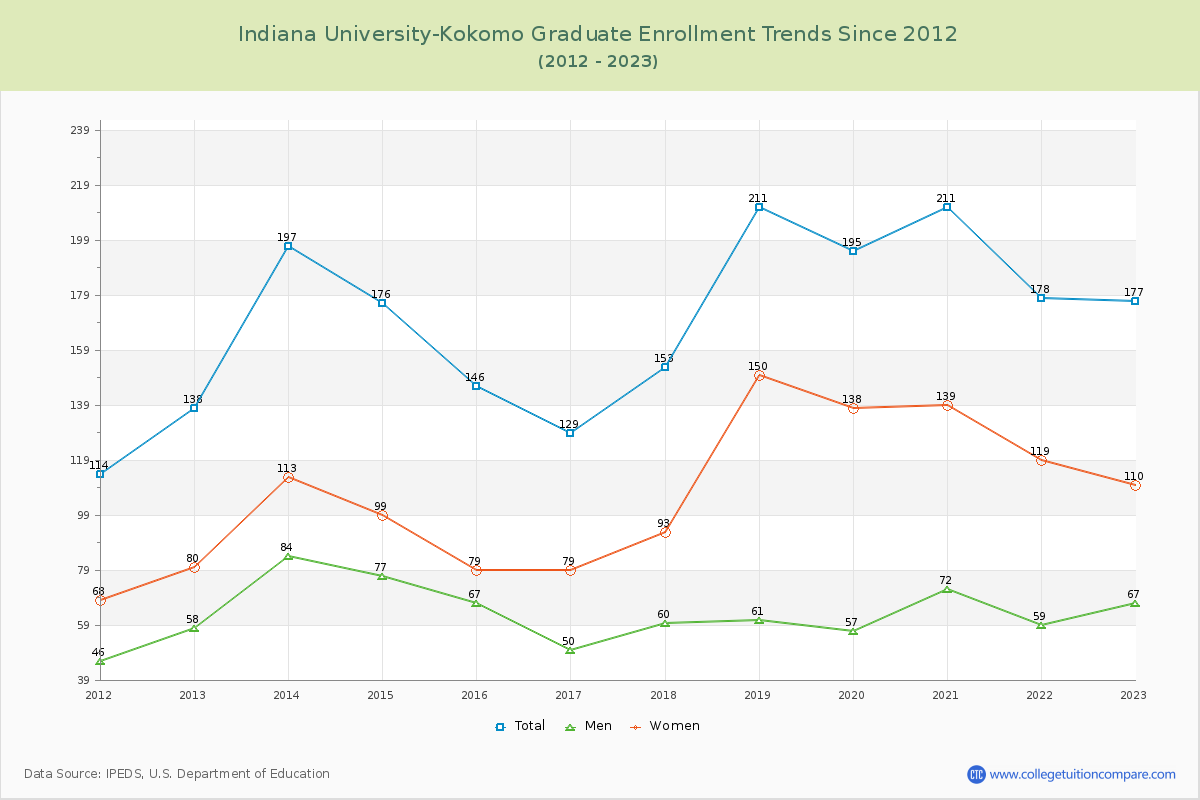
93.78% of total students is undergraduate students and 6.22% students is graduate students. The number of undergraduate students has decreased by 912 and the graduate enrollment has increased by 39 over past 10 years.
The female to male ratio is 1.88 to 1 and it means that there are more female students enrolled in IUK than male students.
The following table and chart illustrate the changes in student population by gender at Indiana University-Kokomo since 2012.
| Year | Total | Undergraduate | Graduate | ||||
|---|---|---|---|---|---|---|---|
| Total | Men | Women | Total | Men | Women | ||
| 2012-13 | 3,719 | 3,581 | 1,293 | 2,288 | 138 | 58 | 80 |
| 2013-14 | 4,178 459 | 3,981 400 | 1,419 126 | 2,562 274 | 197 59 | 84 26 | 113 33 |
| 2014-15 | 4,180 2 | 4,004 23 | 1,377 -42 | 2,627 65 | 176 -21 | 77 -7 | 99 -14 |
| 2015-16 | 4,090 -90 | 3,944 -60 | 1,359 -18 | 2,585 -42 | 146 -30 | 67 -10 | 79 -20 |
| 2016-17 | 4,106 16 | 3,977 33 | 1,372 13 | 2,605 20 | 129 -17 | 50 -17 | 79 0 |
| 2017-18 | 3,029 -1,077 | 2,876 -1,101 | 1,023 -349 | 1,853 -752 | 153 24 | 60 10 | 93 14 |
| 2018-19 | 3,123 94 | 2,912 36 | 1,053 30 | 1,859 6 | 211 58 | 61 1 | 150 57 |
| 2019-20 | 3,164 41 | 2,969 57 | 1,030 -23 | 1,939 80 | 195 -16 | 57 -4 | 138 -12 |
| 2020-21 | 3,227 63 | 3,016 47 | 1,066 36 | 1,950 11 | 211 16 | 72 15 | 139 1 |
| 2021-22 | 2,995 -232 | 2,817 -199 | 1,012 -54 | 1,805 -145 | 178 -33 | 59 -13 | 119 -20 |
| 2022-23 | 2,846 -149 | 2,669 -148 | 921 -91 | 1,748 -57 | 177 -1 | 67 8 | 110 -9 |
| Average | 3,514 | 3,341 | 1,175 | 2,166 | 174 | 65 | 109 |