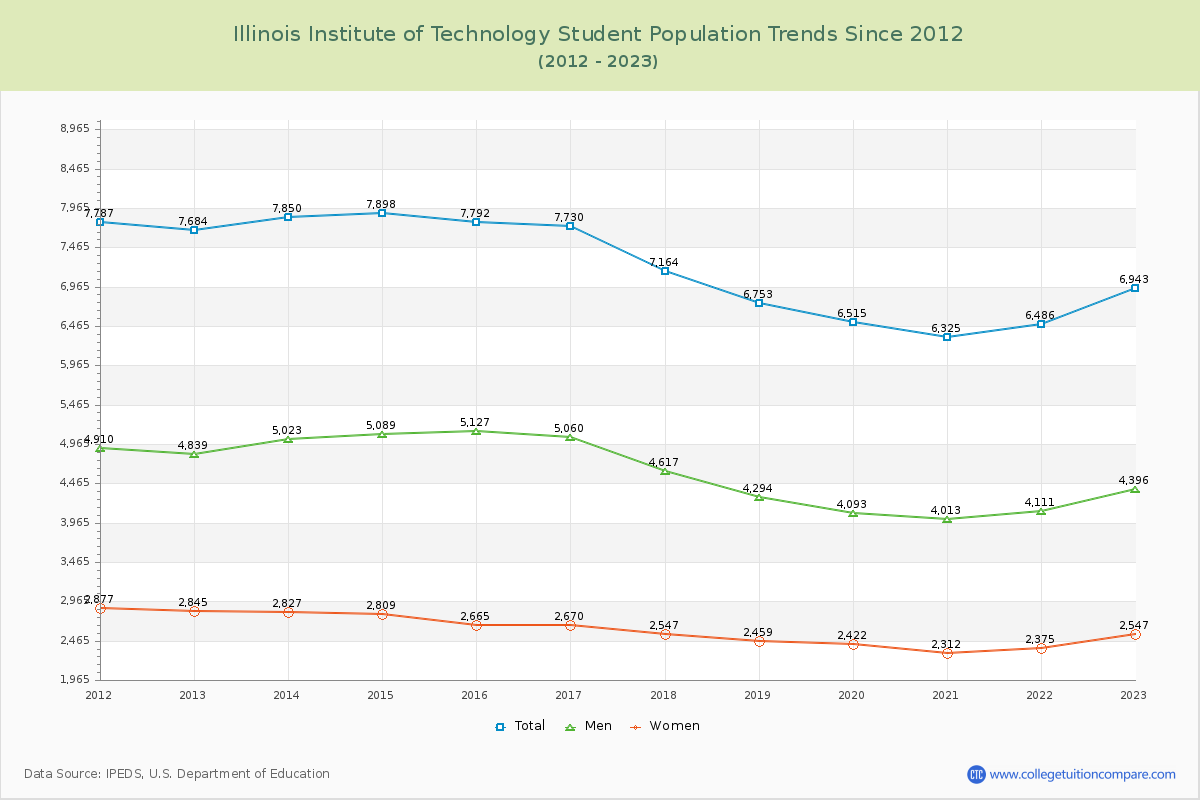
Student Population Changes
The average student population over the last 12 years is 7,195 where 6,943 students are attending the school for the academic year 2022-2023.
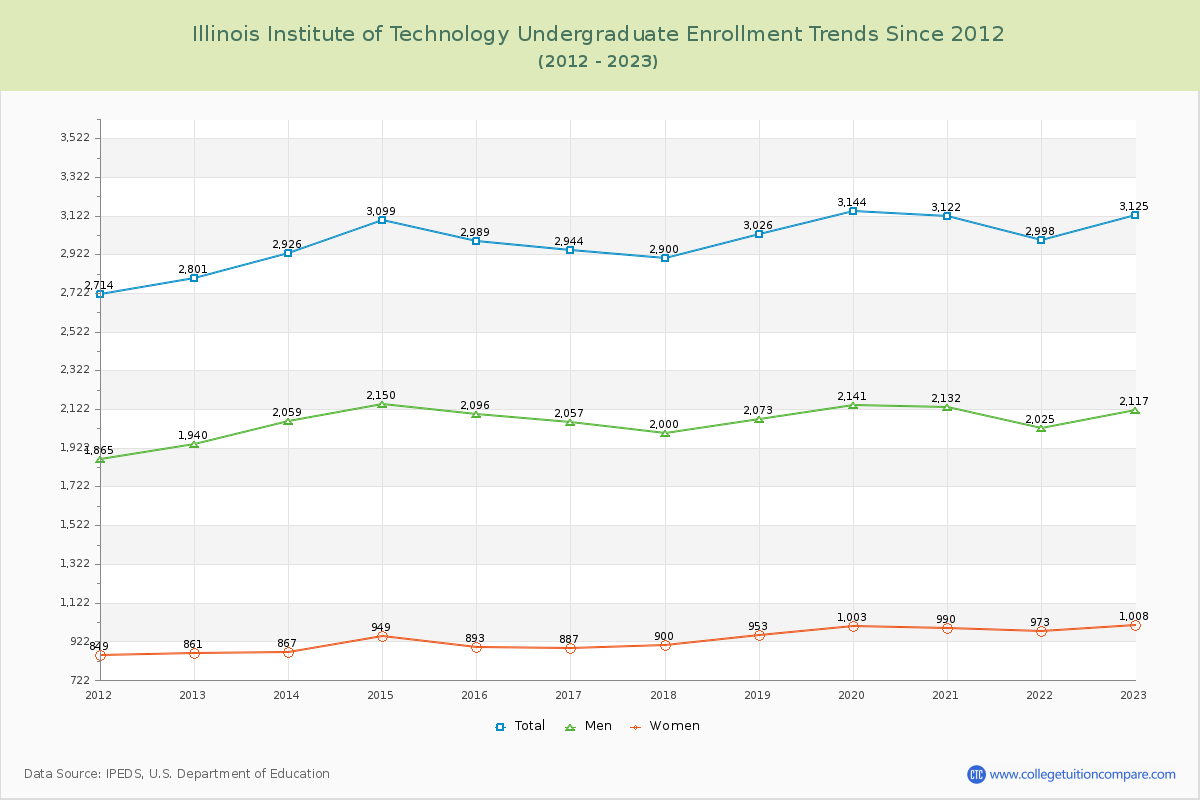
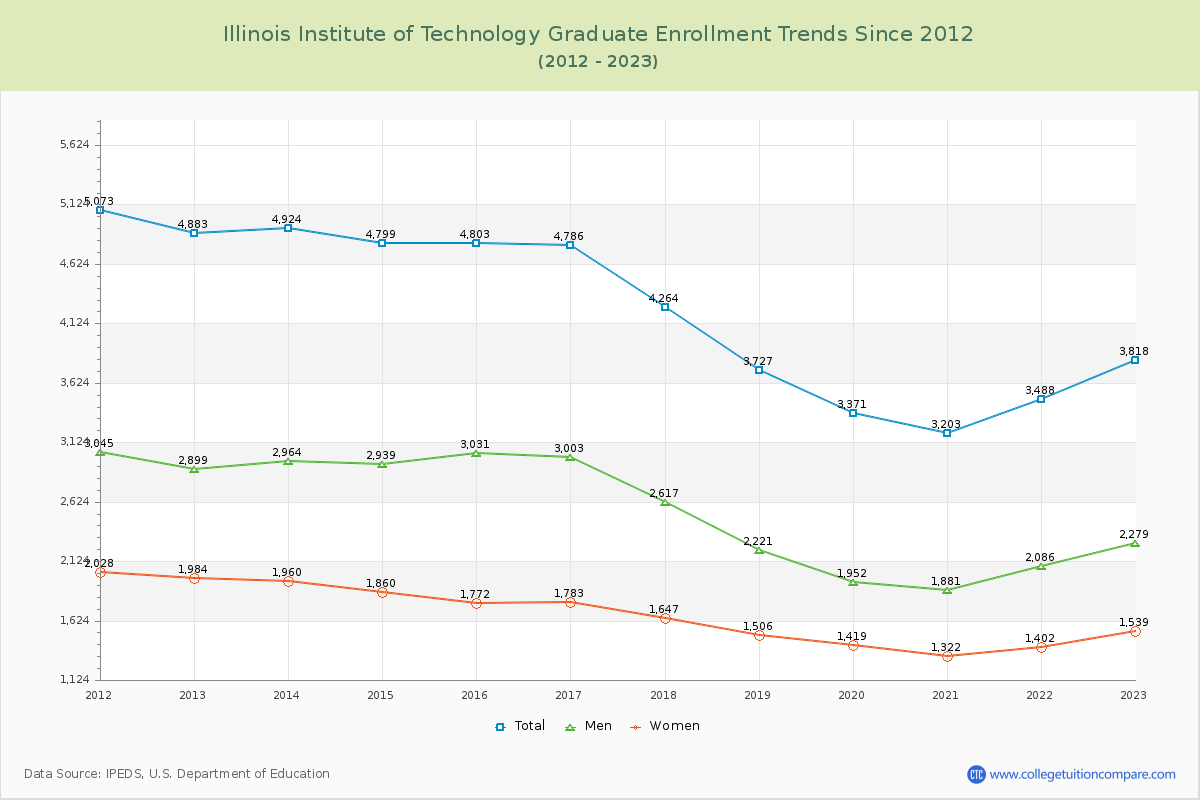
45.01% of total students is undergraduate students and 54.99% students is graduate students. The number of undergraduate students has increased by 324 and the graduate enrollment has decreased by 1,065 over past 10 years.
The female to male ratio is 0.58 to 1 and it means that there are more male students enrolled in IIT than female students.
The following table and chart illustrate the changes in student population by gender at Illinois Institute of Technology since 2012.
| Year | Total | Undergraduate | Graduate | ||||
|---|---|---|---|---|---|---|---|
| Total | Men | Women | Total | Men | Women | ||
| 2012-13 | 7,684 | 2,801 | 1,940 | 861 | 4,883 | 2,899 | 1,984 |
| 2013-14 | 7,850 166 | 2,926 125 | 2,059 119 | 867 6 | 4,924 41 | 2,964 65 | 1,960 -24 |
| 2014-15 | 7,898 48 | 3,099 173 | 2,150 91 | 949 82 | 4,799 -125 | 2,939 -25 | 1,860 -100 |
| 2015-16 | 7,792 -106 | 2,989 -110 | 2,096 -54 | 893 -56 | 4,803 4 | 3,031 92 | 1,772 -88 |
| 2016-17 | 7,730 -62 | 2,944 -45 | 2,057 -39 | 887 -6 | 4,786 -17 | 3,003 -28 | 1,783 11 |
| 2017-18 | 7,164 -566 | 2,900 -44 | 2,000 -57 | 900 13 | 4,264 -522 | 2,617 -386 | 1,647 -136 |
| 2018-19 | 6,753 -411 | 3,026 126 | 2,073 73 | 953 53 | 3,727 -537 | 2,221 -396 | 1,506 -141 |
| 2019-20 | 6,515 -238 | 3,144 118 | 2,141 68 | 1,003 50 | 3,371 -356 | 1,952 -269 | 1,419 -87 |
| 2020-21 | 6,325 -190 | 3,122 -22 | 2,132 -9 | 990 -13 | 3,203 -168 | 1,881 -71 | 1,322 -97 |
| 2021-22 | 6,486 161 | 2,998 -124 | 2,025 -107 | 973 -17 | 3,488 285 | 2,086 205 | 1,402 80 |
| 2022-23 | 6,943 457 | 3,125 127 | 2,117 92 | 1,008 35 | 3,818 330 | 2,279 193 | 1,539 137 |
| Average | 7,195 | 3,007 | 2,072 | 935 | 4,188 | 2,534 | 1,654 |