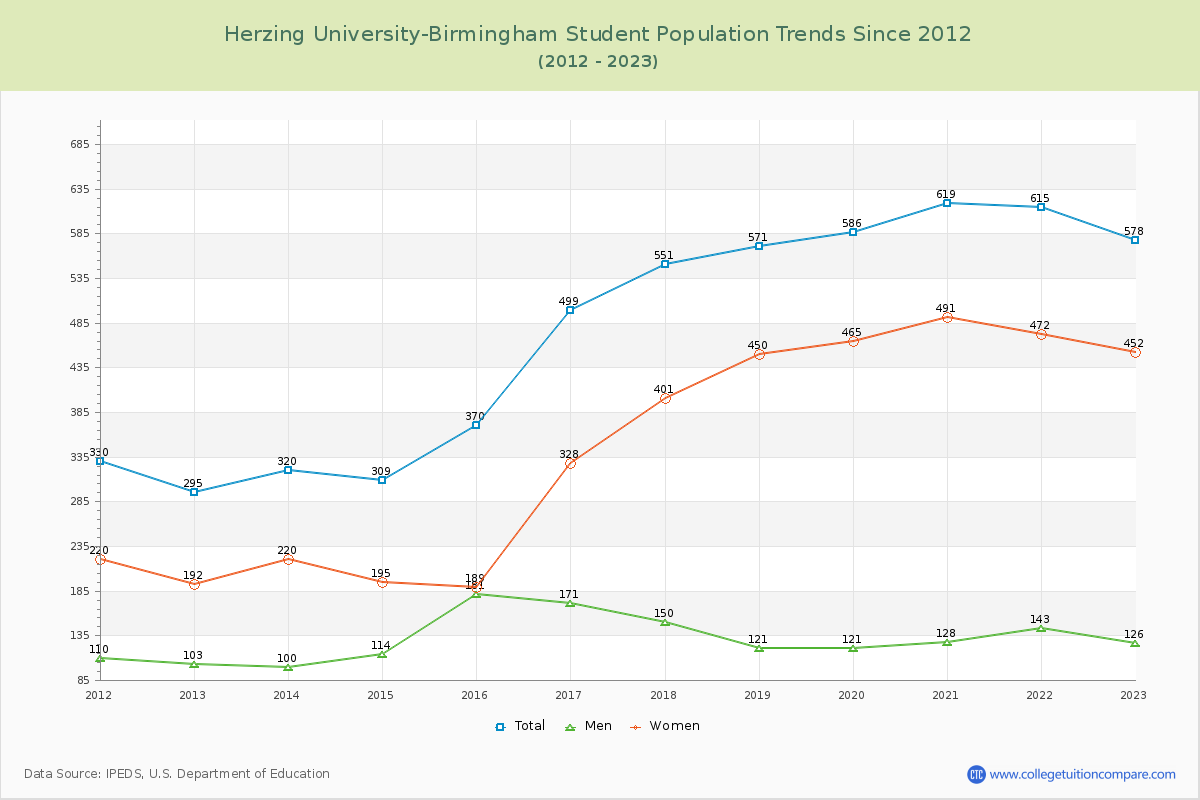
Student Population Changes
The average student population over the last 12 years is 483 where 578 students are attending the school for the academic year 2022-2023.
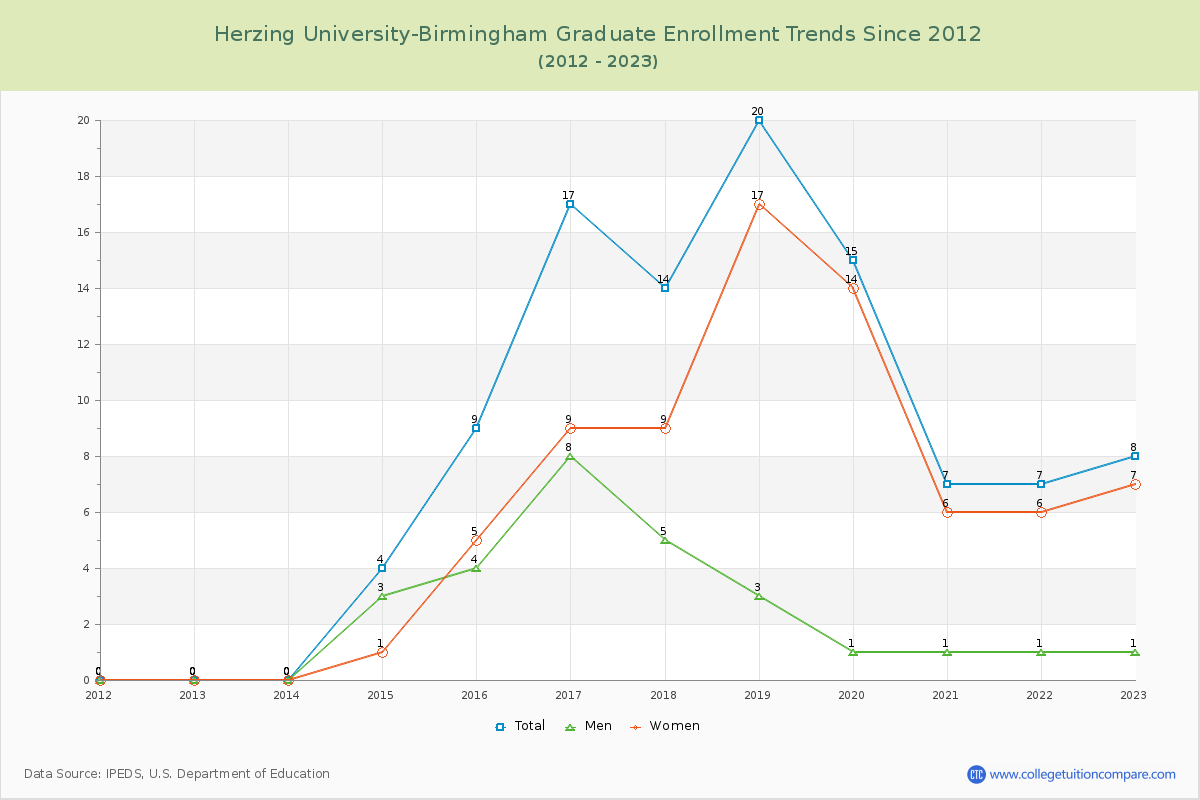
98.62% of total students is undergraduate students and 1.38% students is graduate students. The number of undergraduate students has increased by 275 and the graduate enrollment has increased by 8 over past 10 years.
The female to male ratio is 3.59 to 1 and it means that there are far more female students enrolled in Herzing University-Birmingham than male students.
The following table and chart illustrate the changes in student population by gender at Herzing University-Birmingham since 2012.
| Year | Total | Undergraduate | Graduate | ||||
|---|---|---|---|---|---|---|---|
| Total | Men | Women | Total | Men | Women | ||
| 2012-13 | 295 | 295 | 103 | 192 | 0 | 0 | 0 |
| 2013-14 | 320 25 | 320 25 | 100 -3 | 220 28 | 0 0 | 0 0 | 0 0 |
| 2014-15 | 309 -11 | 305 -15 | 111 11 | 194 -26 | 4 4 | 3 3 | 1 1 |
| 2015-16 | 370 61 | 361 56 | 177 66 | 184 -10 | 9 5 | 4 1 | 5 4 |
| 2016-17 | 499 129 | 482 121 | 163 -14 | 319 135 | 17 8 | 8 4 | 9 4 |
| 2017-18 | 551 52 | 537 55 | 145 -18 | 392 73 | 14 -3 | 5 -3 | 9 0 |
| 2018-19 | 571 20 | 551 14 | 118 -27 | 433 41 | 20 6 | 3 -2 | 17 8 |
| 2019-20 | 586 15 | 571 20 | 120 2 | 451 18 | 15 -5 | 1 -2 | 14 -3 |
| 2020-21 | 619 33 | 612 41 | 127 7 | 485 34 | 7 -8 | 1 0 | 6 -8 |
| 2021-22 | 615 -4 | 608 -4 | 142 15 | 466 -19 | 7 0 | 1 0 | 6 0 |
| 2022-23 | 578 -37 | 570 -38 | 125 -17 | 445 -21 | 8 1 | 1 0 | 7 1 |
| Average | 483 | 474 | 130 | 344 | 9 | 2 | 7 |