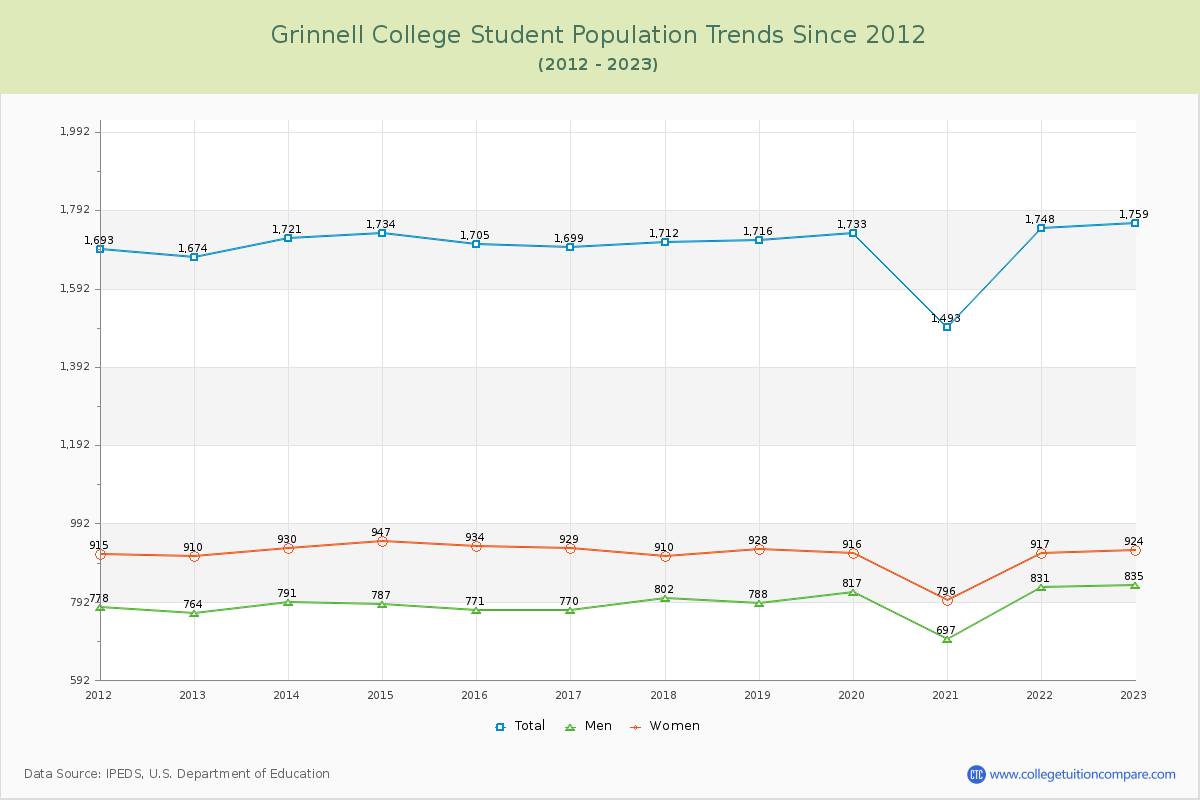
Student Population Changes
The average student population over the last 12 years is 1,699 where 1,759 students are attending the school for the academic year 2022-2023.
The female to male ratio is 1.11 to 1 and it means that there are slightly more female students enrolled in Grinnell than male students.
The following table and chart illustrate the changes in student population by gender at Grinnell College since 2012.
| Year | Total | Men | Women |
|---|---|---|---|
| 2012-13 | 1,674 | 764 | 910 |
| 2013-14 | 1,721 47 | 791 27 | 930 20 |
| 2014-15 | 1,734 13 | 787 -4 | 947 17 |
| 2015-16 | 1,705 -29 | 771 -16 | 934 -13 |
| 2016-17 | 1,699 -6 | 770 -1 | 929 -5 |
| 2017-18 | 1,712 13 | 802 32 | 910 -19 |
| 2018-19 | 1,716 4 | 788 -14 | 928 18 |
| 2019-20 | 1,733 17 | 817 29 | 916 -12 |
| 2020-21 | 1,493 -240 | 697 -120 | 796 -120 |
| 2021-22 | 1,748 255 | 831 134 | 917 121 |
| 2022-23 | 1,759 11 | 835 4 | 924 7 |
| Average | 1,699 | 787 | 913 |