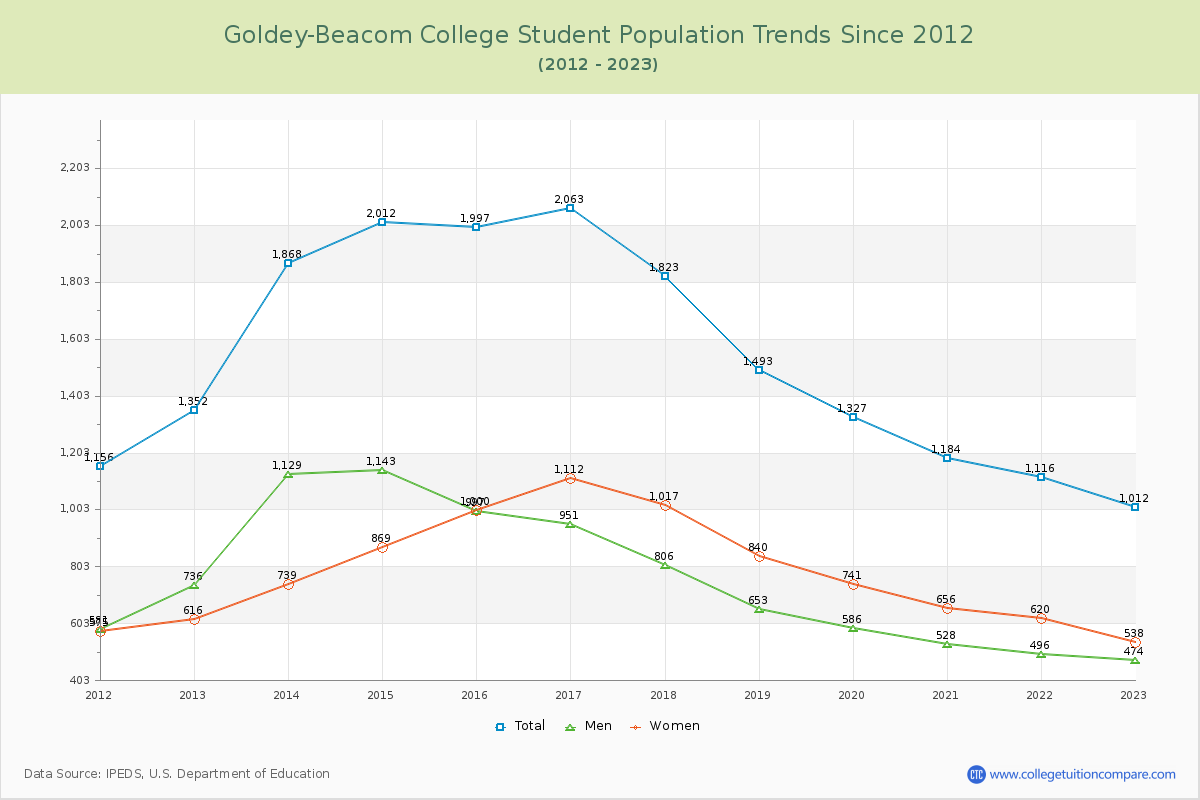
Student Population Changes
The average student population over the last 12 years is 1,568 where 1,012 students are attending the school for the academic year 2022-2023.
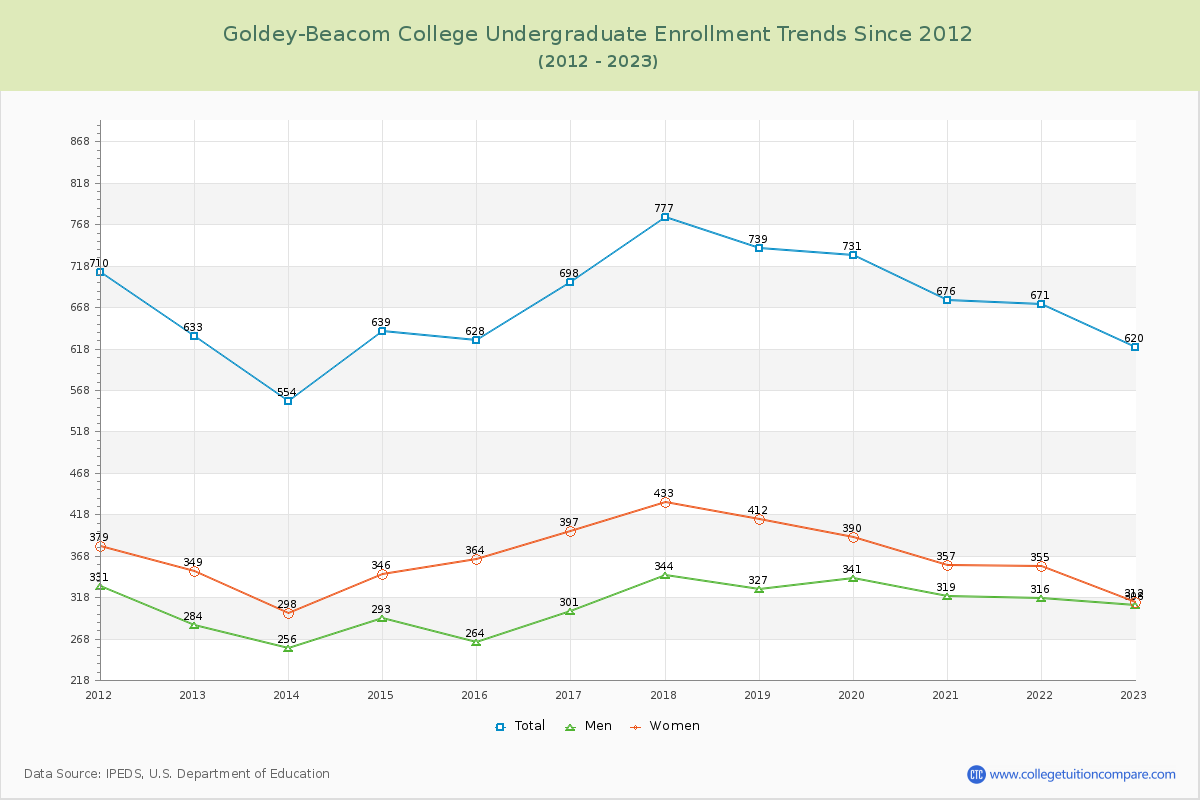
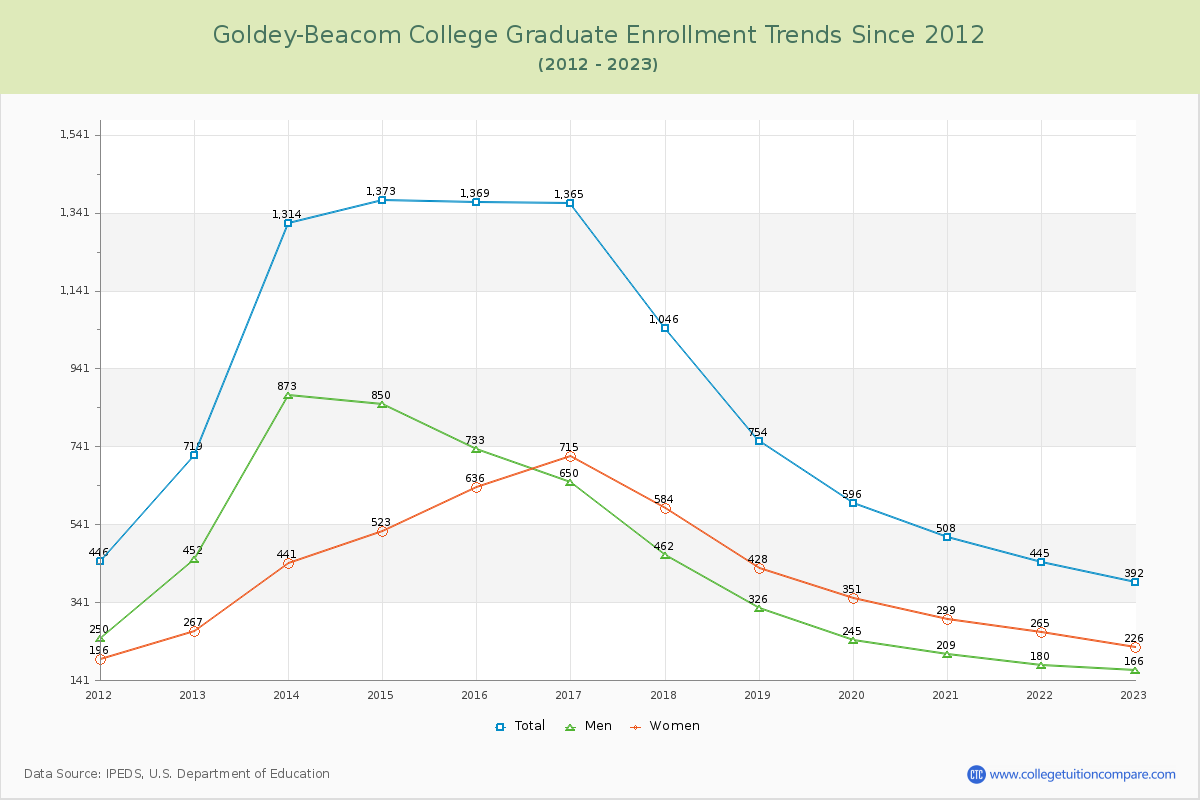
61.26% of total students is undergraduate students and 38.74% students is graduate students. The number of undergraduate students has decreased by 13 and the graduate enrollment has decreased by 327 over past 10 years.
The female to male ratio is 1.14 to 1 and it means that there are slightly more female students enrolled in Goldey-Beacom than male students.
The following table and chart illustrate the changes in student population by gender at Goldey-Beacom College since 2012.
| Year | Total | Undergraduate | Graduate | ||||
|---|---|---|---|---|---|---|---|
| Total | Men | Women | Total | Men | Women | ||
| 2012-13 | 1,352 | 633 | 284 | 349 | 719 | 452 | 267 |
| 2013-14 | 1,868 516 | 554 -79 | 256 -28 | 298 -51 | 1,314 595 | 873 421 | 441 174 |
| 2014-15 | 2,012 144 | 639 85 | 293 37 | 346 48 | 1,373 59 | 850 -23 | 523 82 |
| 2015-16 | 1,997 -15 | 628 -11 | 264 -29 | 364 18 | 1,369 -4 | 733 -117 | 636 113 |
| 2016-17 | 2,063 66 | 698 70 | 301 37 | 397 33 | 1,365 -4 | 650 -83 | 715 79 |
| 2017-18 | 1,823 -240 | 777 79 | 344 43 | 433 36 | 1,046 -319 | 462 -188 | 584 -131 |
| 2018-19 | 1,493 -330 | 739 -38 | 327 -17 | 412 -21 | 754 -292 | 326 -136 | 428 -156 |
| 2019-20 | 1,327 -166 | 731 -8 | 341 14 | 390 -22 | 596 -158 | 245 -81 | 351 -77 |
| 2020-21 | 1,184 -143 | 676 -55 | 319 -22 | 357 -33 | 508 -88 | 209 -36 | 299 -52 |
| 2021-22 | 1,116 -68 | 671 -5 | 316 -3 | 355 -2 | 445 -63 | 180 -29 | 265 -34 |
| 2022-23 | 1,012 -104 | 620 -51 | 308 -8 | 312 -43 | 392 -53 | 166 -14 | 226 -39 |
| Average | 1,568 | 670 | 305 | 365 | 898 | 468 | 430 |