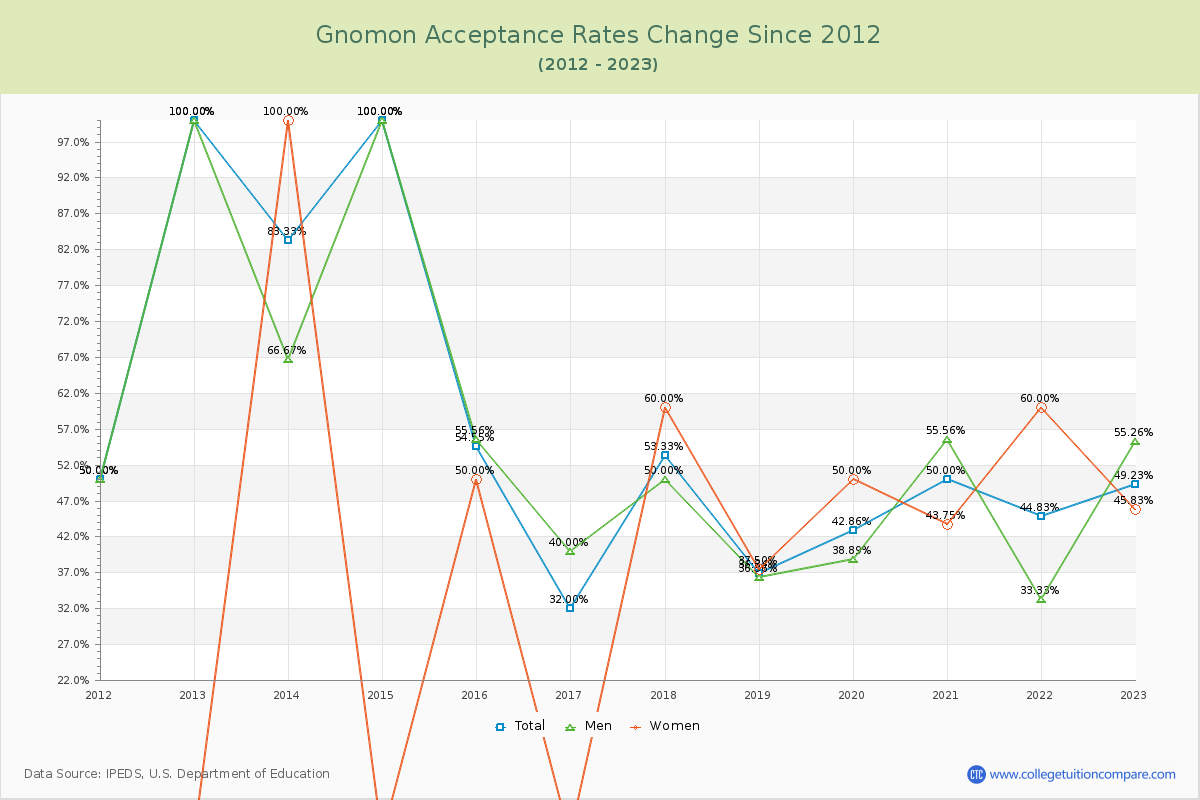
Acceptance Rate Changes
The average acceptance rate over the last 10 years is 58.82%, and this year's acceptance rate is 49.23% at Gnomon. By gender, men students' acceptance rate is 57.42% and women students' rate is 40.64%.
The next table and chart illustrate the acceptance rates changes at Gnomon over the past 11 years (2012-2023).
| Year | Total | Men | Women |
|---|---|---|---|
| 2012-13 | 100.00% | 100.00% | 0.00% |
| 2013-14 | 83.33% -16.67% |
66.67% 100.00% |
100.00% 100.00% |
| 2014-15 | 100.00% 16.67% |
100.00% -100.00% |
0.00% -100.00% |
| 2015-16 | 54.55% -45.45% |
55.56% 50.00% |
50.00% 50.00% |
| 2016-17 | 32.00% -22.55% |
40.00% -50.00% |
0.00% -50.00% |
| 2017-18 | 53.33% 21.33% |
50.00% 60.00% |
60.00% 60.00% |
| 2018-19 | 36.84% -16.49% |
36.36% -22.50% |
37.50% -22.50% |
| 2019-20 | 42.86% 6.02% |
38.89% 12.50% |
50.00% 12.50% |
| 2020-21 | 50.00% 7.14% |
55.56% -6.25% |
43.75% -6.25% |
| 2021-22 | 44.83% -5.17% |
33.33% 16.25% |
60.00% 16.25% |
| 2022-23 | 49.23% 4.40% |
55.26% -14.17% |
45.83% -14.17% |
| Average | 58.82% | 57.42% | 40.64% |