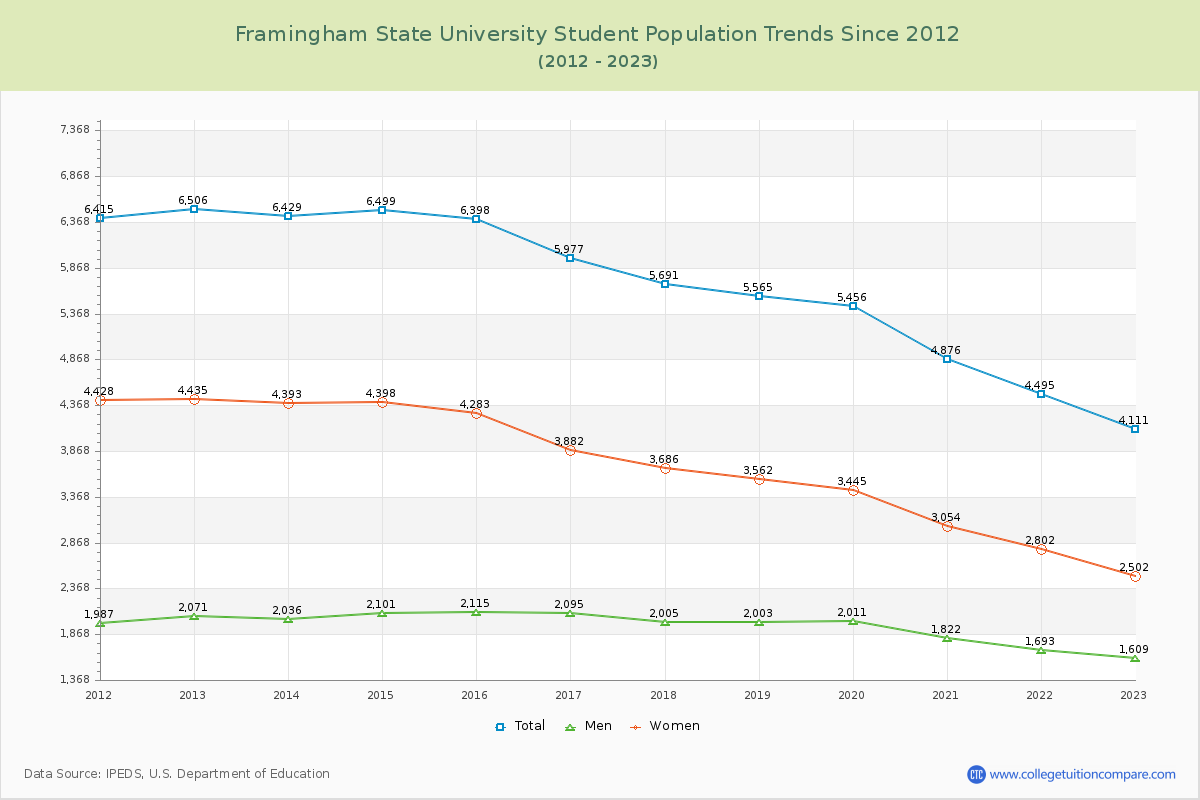
Student Population Changes
The average student population over the last 12 years is 5,637 where 4,111 students are attending the school for the academic year 2022-2023.
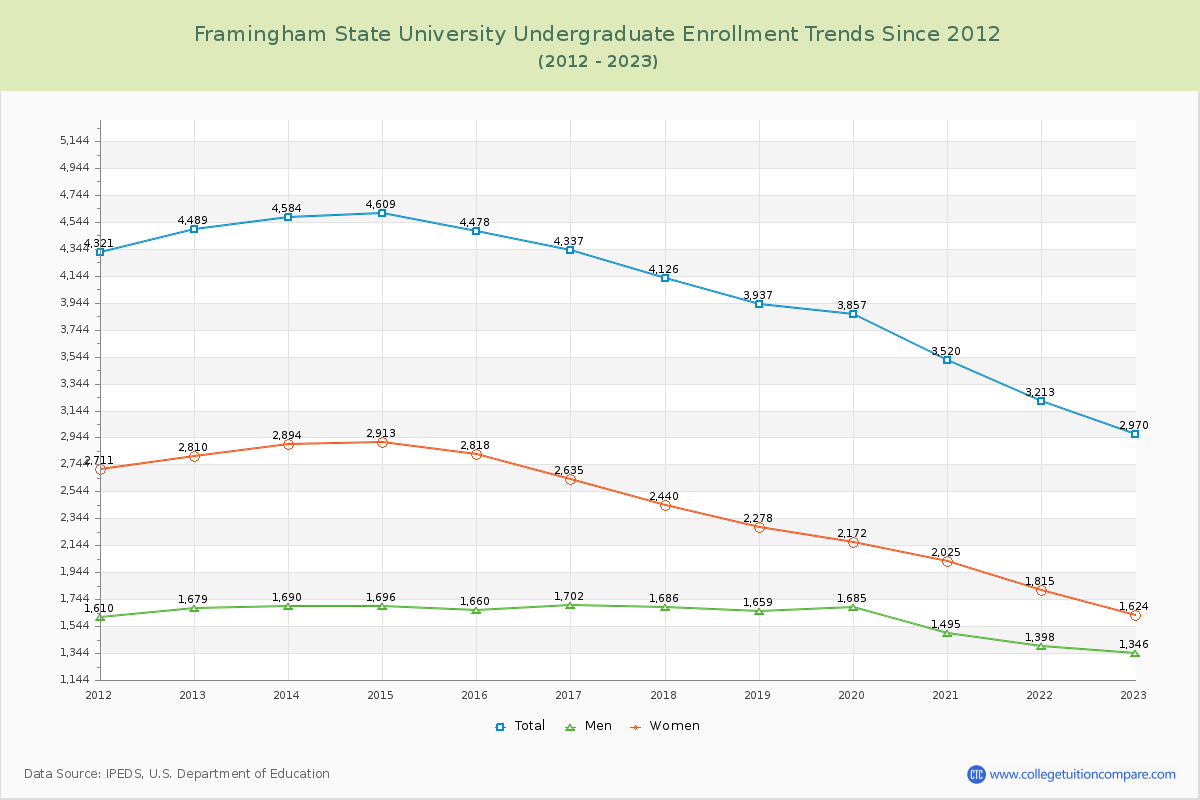
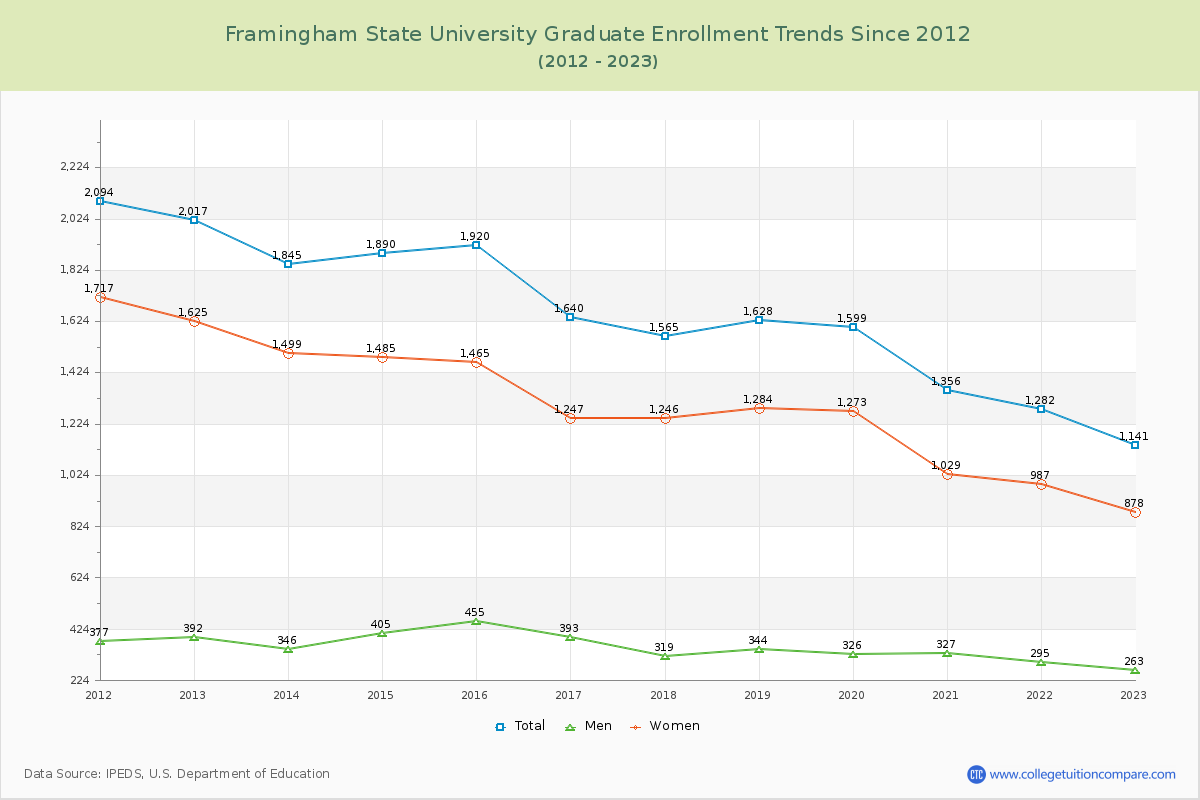
72.25% of total students is undergraduate students and 27.75% students is graduate students. The number of undergraduate students has decreased by 1,519 and the graduate enrollment has decreased by 876 over past 10 years.
The female to male ratio is 1.56 to 1 and it means that there are more female students enrolled in Framingham State than male students.
The following table and chart illustrate the changes in student population by gender at Framingham State University since 2012.
| Year | Total | Undergraduate | Graduate | ||||
|---|---|---|---|---|---|---|---|
| Total | Men | Women | Total | Men | Women | ||
| 2012-13 | 6,506 | 4,489 | 1,679 | 2,810 | 2,017 | 392 | 1,625 |
| 2013-14 | 6,429 -77 | 4,584 95 | 1,690 11 | 2,894 84 | 1,845 -172 | 346 -46 | 1,499 -126 |
| 2014-15 | 6,499 70 | 4,609 25 | 1,696 6 | 2,913 19 | 1,890 45 | 405 59 | 1,485 -14 |
| 2015-16 | 6,398 -101 | 4,478 -131 | 1,660 -36 | 2,818 -95 | 1,920 30 | 455 50 | 1,465 -20 |
| 2016-17 | 5,977 -421 | 4,337 -141 | 1,702 42 | 2,635 -183 | 1,640 -280 | 393 -62 | 1,247 -218 |
| 2017-18 | 5,691 -286 | 4,126 -211 | 1,686 -16 | 2,440 -195 | 1,565 -75 | 319 -74 | 1,246 -1 |
| 2018-19 | 5,565 -126 | 3,937 -189 | 1,659 -27 | 2,278 -162 | 1,628 63 | 344 25 | 1,284 38 |
| 2019-20 | 5,456 -109 | 3,857 -80 | 1,685 26 | 2,172 -106 | 1,599 -29 | 326 -18 | 1,273 -11 |
| 2020-21 | 4,876 -580 | 3,520 -337 | 1,495 -190 | 2,025 -147 | 1,356 -243 | 327 1 | 1,029 -244 |
| 2021-22 | 4,495 -381 | 3,213 -307 | 1,398 -97 | 1,815 -210 | 1,282 -74 | 295 -32 | 987 -42 |
| 2022-23 | 4,111 -384 | 2,970 -243 | 1,346 -52 | 1,624 -191 | 1,141 -141 | 263 -32 | 878 -109 |
| Average | 5,637 | 4,011 | 1,609 | 2,402 | 1,626 | 351 | 1,274 |