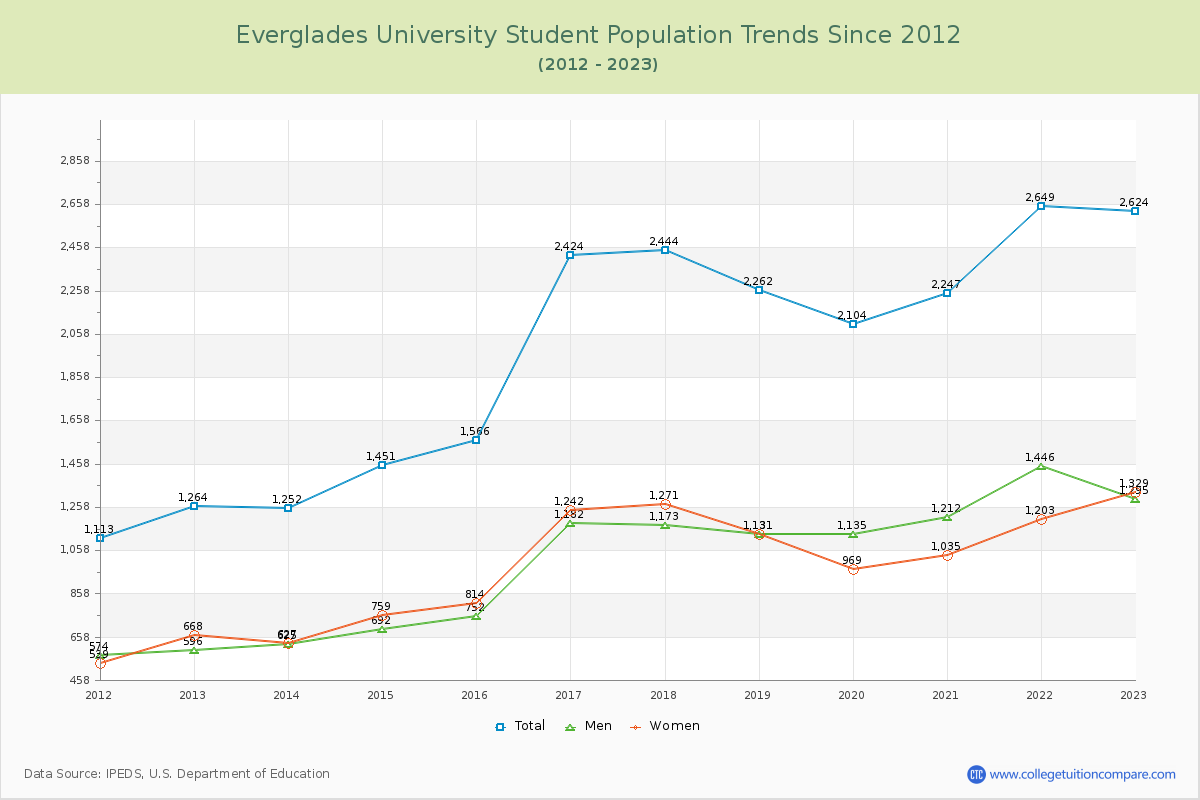
Student Population Changes
The average student population over the last 12 years is 2,026 where 2,624 students are attending the school for the academic year 2022-2023.
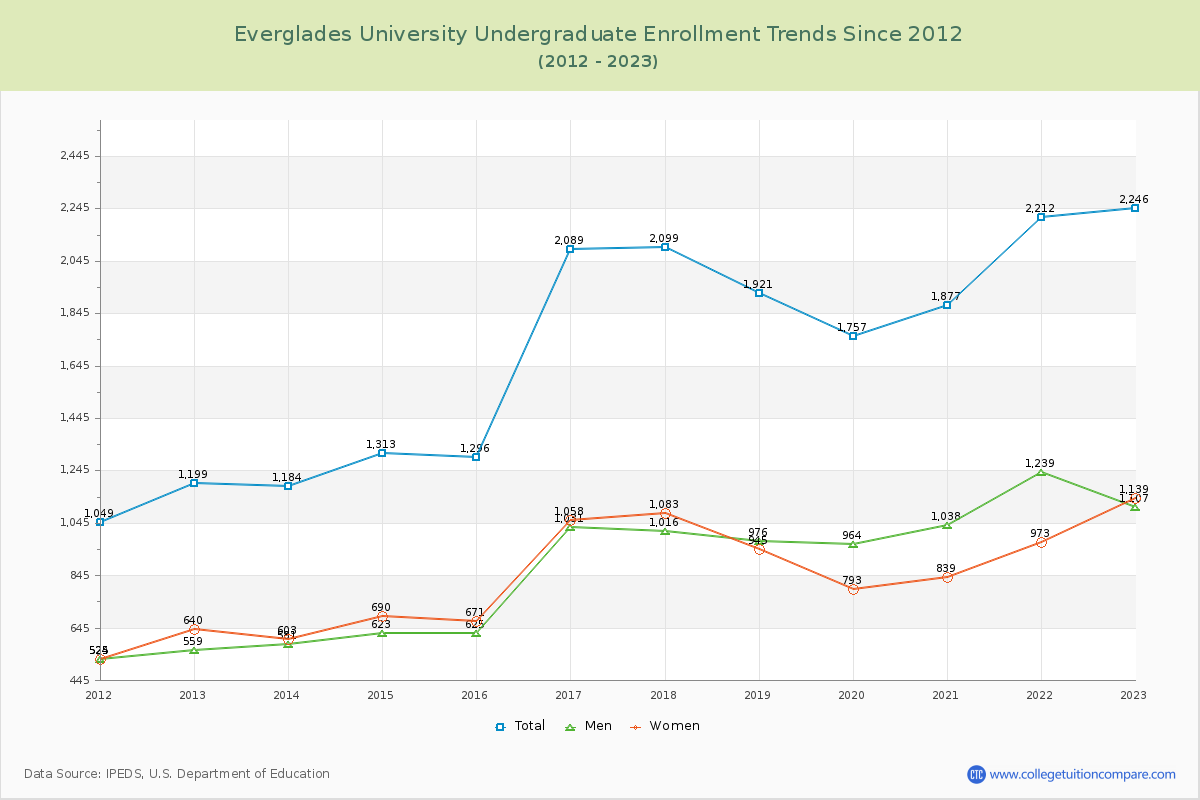
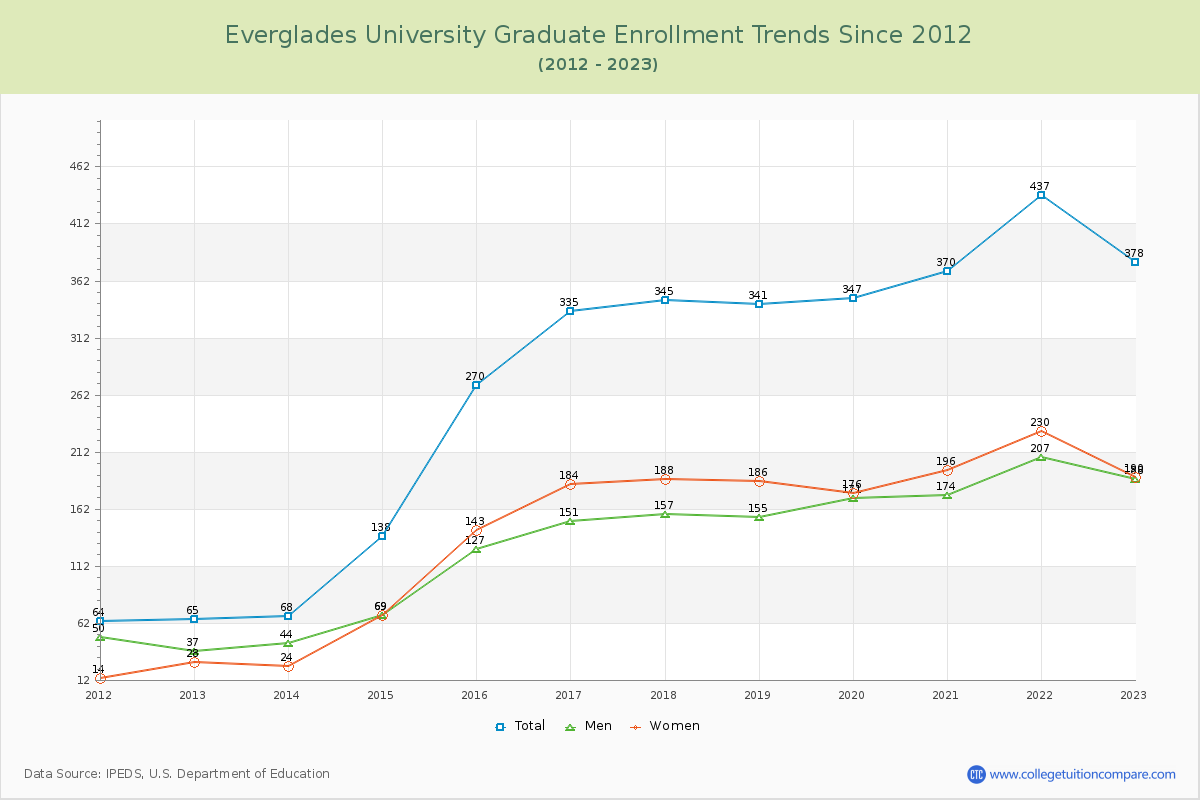
85.59% of total students is undergraduate students and 14.41% students is graduate students. The number of undergraduate students has increased by 1,047 and the graduate enrollment has increased by 313 over past 10 years.
The female to male ratio is 1.03 to 1 and it means that there are similar numbers of female and male students enrolled in Everglades.
The following table and chart illustrate the changes in student population by gender at Everglades University since 2012.
| Year | Total | Undergraduate | Graduate | ||||
|---|---|---|---|---|---|---|---|
| Total | Men | Women | Total | Men | Women | ||
| 2012-13 | 1,264 | 1,199 | 559 | 640 | 65 | 37 | 28 |
| 2013-14 | 1,252 -12 | 1,184 -15 | 581 22 | 603 -37 | 68 3 | 44 7 | 24 -4 |
| 2014-15 | 1,451 199 | 1,313 129 | 623 42 | 690 87 | 138 70 | 69 25 | 69 45 |
| 2015-16 | 1,566 115 | 1,296 -17 | 625 2 | 671 -19 | 270 132 | 127 58 | 143 74 |
| 2016-17 | 2,424 858 | 2,089 793 | 1,031 406 | 1,058 387 | 335 65 | 151 24 | 184 41 |
| 2017-18 | 2,444 20 | 2,099 10 | 1,016 -15 | 1,083 25 | 345 10 | 157 6 | 188 4 |
| 2018-19 | 2,262 -182 | 1,921 -178 | 976 -40 | 945 -138 | 341 -4 | 155 -2 | 186 -2 |
| 2019-20 | 2,104 -158 | 1,757 -164 | 964 -12 | 793 -152 | 347 6 | 171 16 | 176 -10 |
| 2020-21 | 2,247 143 | 1,877 120 | 1,038 74 | 839 46 | 370 23 | 174 3 | 196 20 |
| 2021-22 | 2,649 402 | 2,212 335 | 1,239 201 | 973 134 | 437 67 | 207 33 | 230 34 |
| 2022-23 | 2,624 -25 | 2,246 34 | 1,107 -132 | 1,139 166 | 378 -59 | 188 -19 | 190 -40 |
| Average | 2,026 | 1,745 | 887 | 858 | 281 | 135 | 147 |