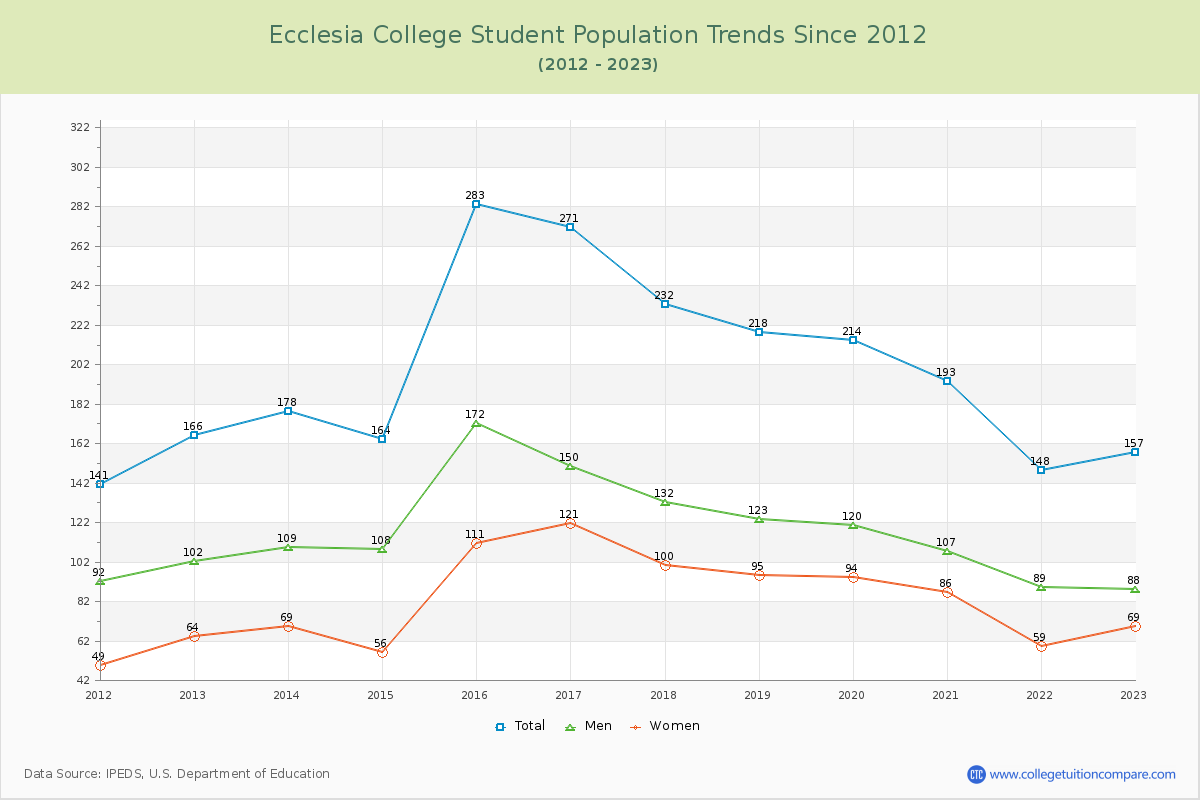
Student Population Changes
The average student population over the last 12 years is 202 where 157 students are attending the school for the academic year 2022-2023.
The female to male ratio is 0.78 to 1 and it means that there are more male students enrolled in Ecclesia than female students.
The following table and chart illustrate the changes in student population by gender at Ecclesia College since 2012.
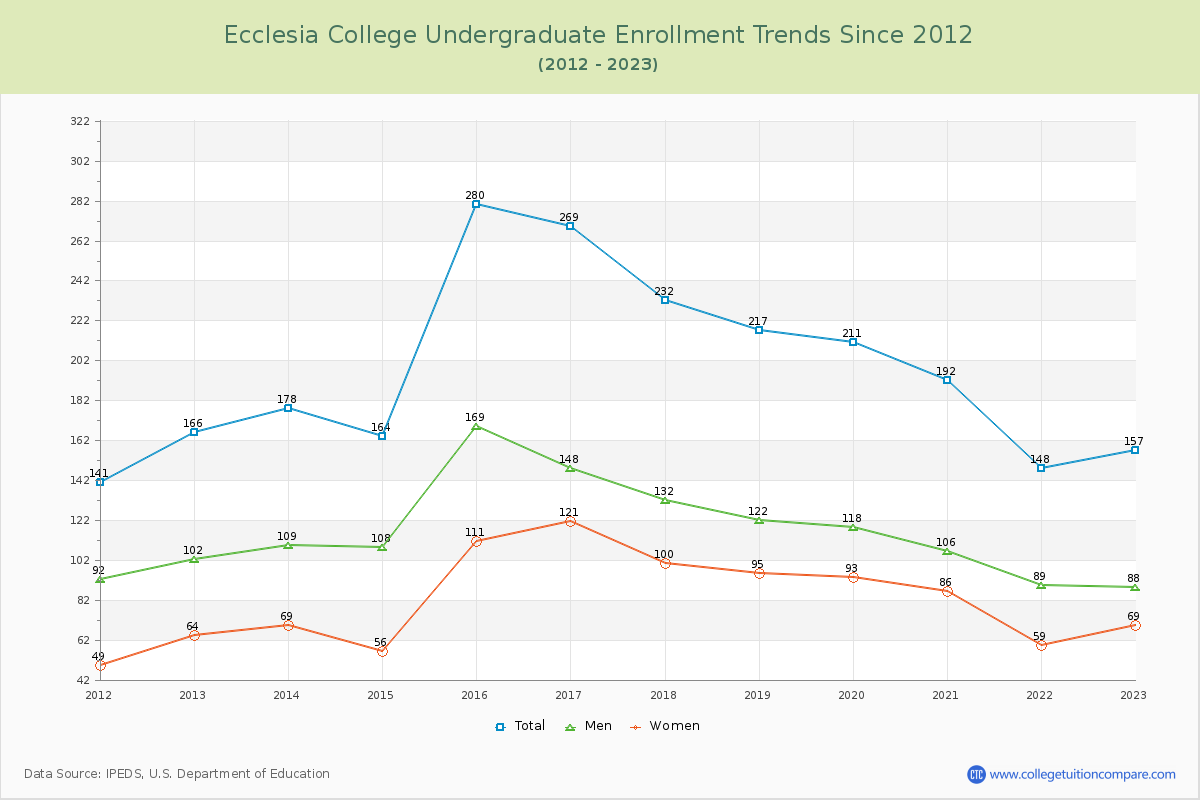
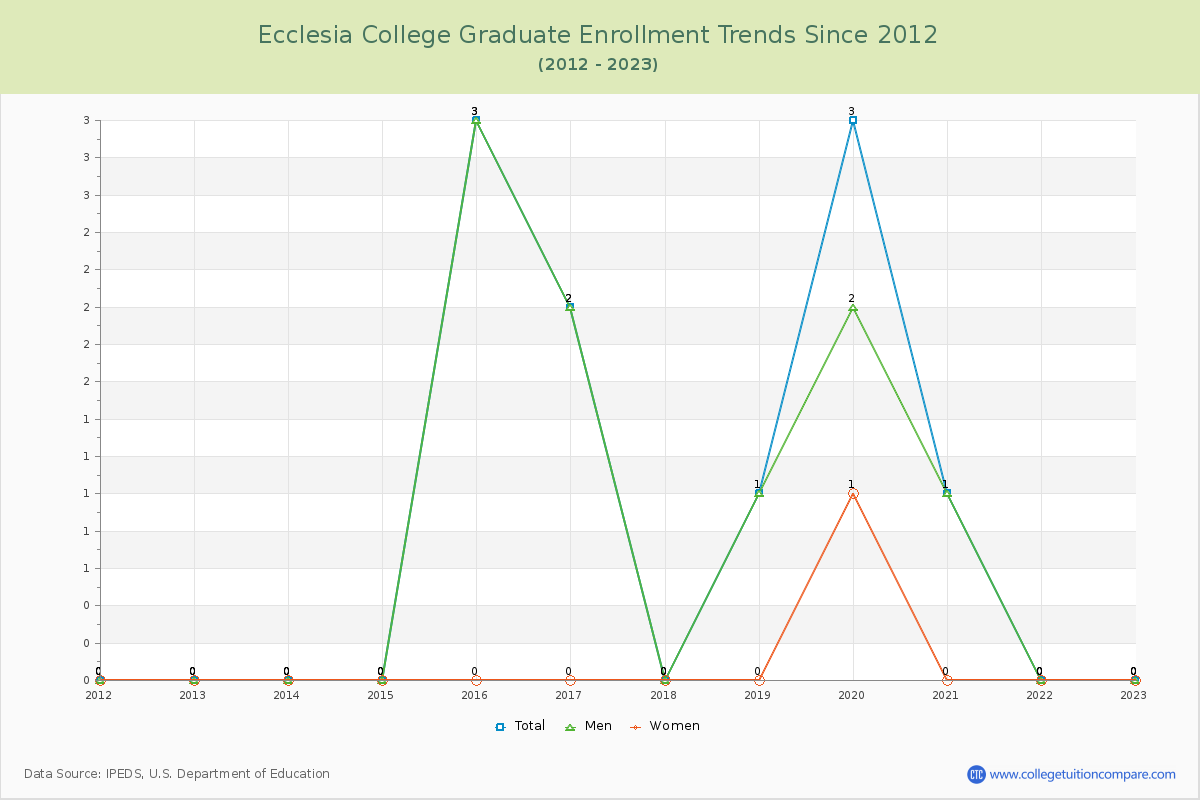
| Year | Total | Undergraduate | Graduate | ||||
|---|---|---|---|---|---|---|---|
| Total | Men | Women | Total | Men | Women | ||
| 2012-13 | 166 | 166 | 102 | 64 | 0 | 0 | 0 |
| 2013-14 | 178 12 | 178 12 | 109 7 | 69 5 | 0 0 | 0 0 | 0 0 |
| 2014-15 | 164 -14 | 164 -14 | 108 -1 | 56 -13 | 0 0 | 0 0 | 0 0 |
| 2015-16 | 283 119 | 280 116 | 169 61 | 111 55 | 3 3 | 3 3 | 0 0 |
| 2016-17 | 271 -12 | 269 -11 | 148 -21 | 121 10 | 2 -1 | 2 -1 | 0 0 |
| 2017-18 | 232 -39 | 232 -37 | 132 -16 | 100 -21 | 0 -2 | 0 -2 | 0 0 |
| 2018-19 | 218 -14 | 217 -15 | 122 -10 | 95 -5 | 1 1 | 1 1 | 0 0 |
| 2019-20 | 214 -4 | 211 -6 | 118 -4 | 93 -2 | 3 2 | 2 1 | 1 1 |
| 2020-21 | 193 -21 | 192 -19 | 106 -12 | 86 -7 | 1 -2 | 1 -1 | 0 -1 |
| 2021-22 | 148 -45 | 148 -44 | 89 -17 | 59 -27 | 0 -1 | 0 -1 | 0 0 |
| 2022-23 | 157 9 | 157 9 | 88 -1 | 69 10 | 0 0 | 0 0 | 0 0 |
| Average | 202 | 201 | 117 | 84 | 1 | 1 | 0 |