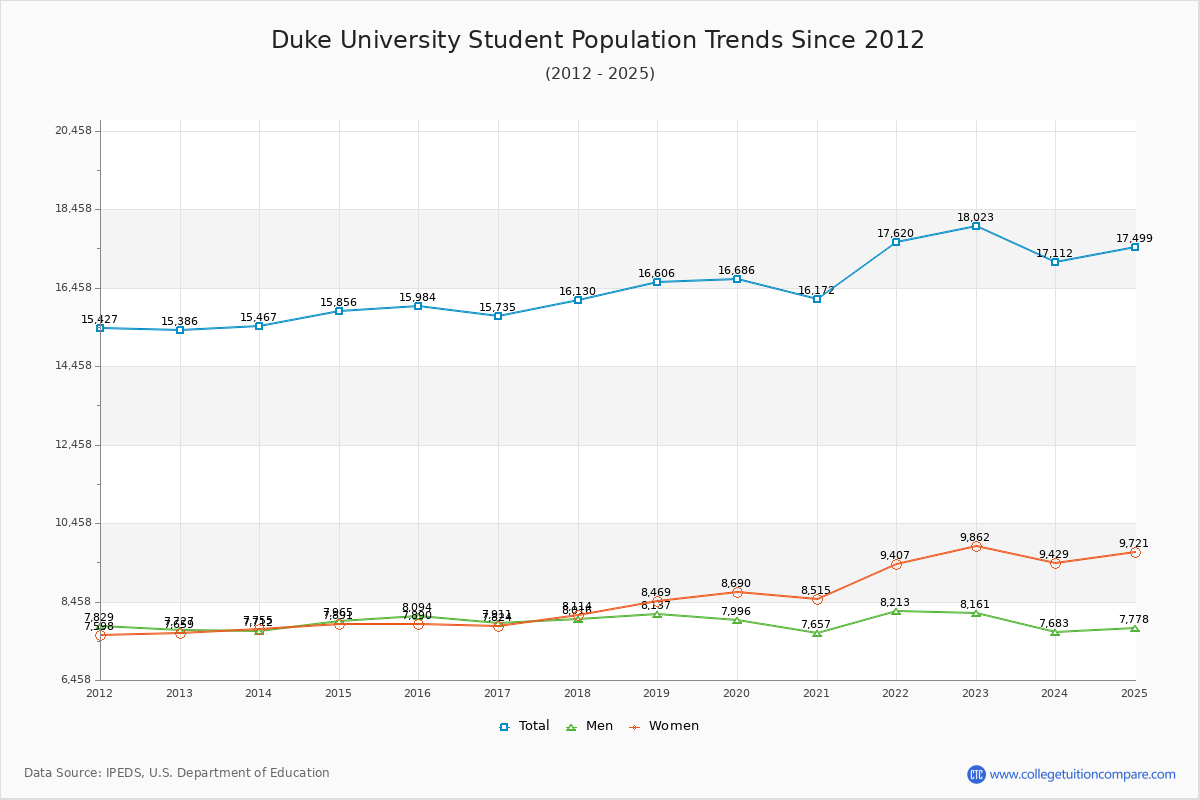
Student Population Changes
The average student population over the last 12 years is 16,333 where 18,023 students are attending the school for the academic year 2022-2023.
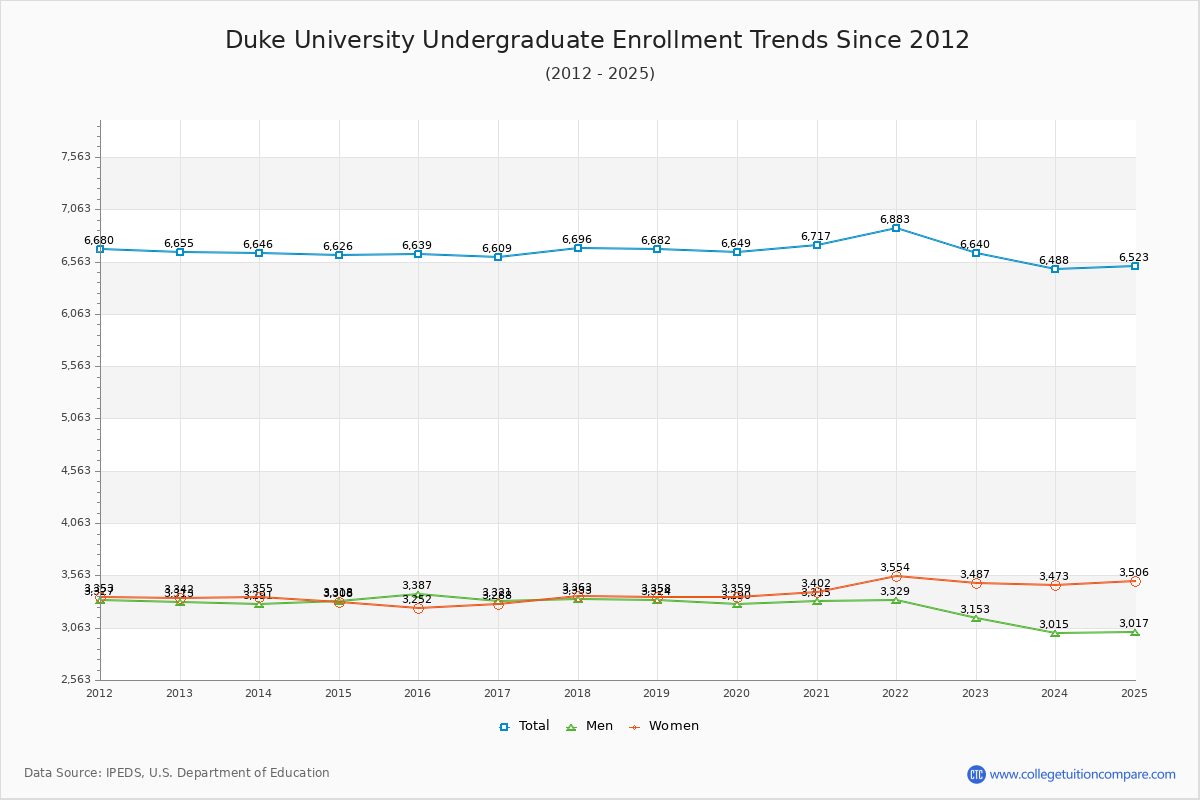
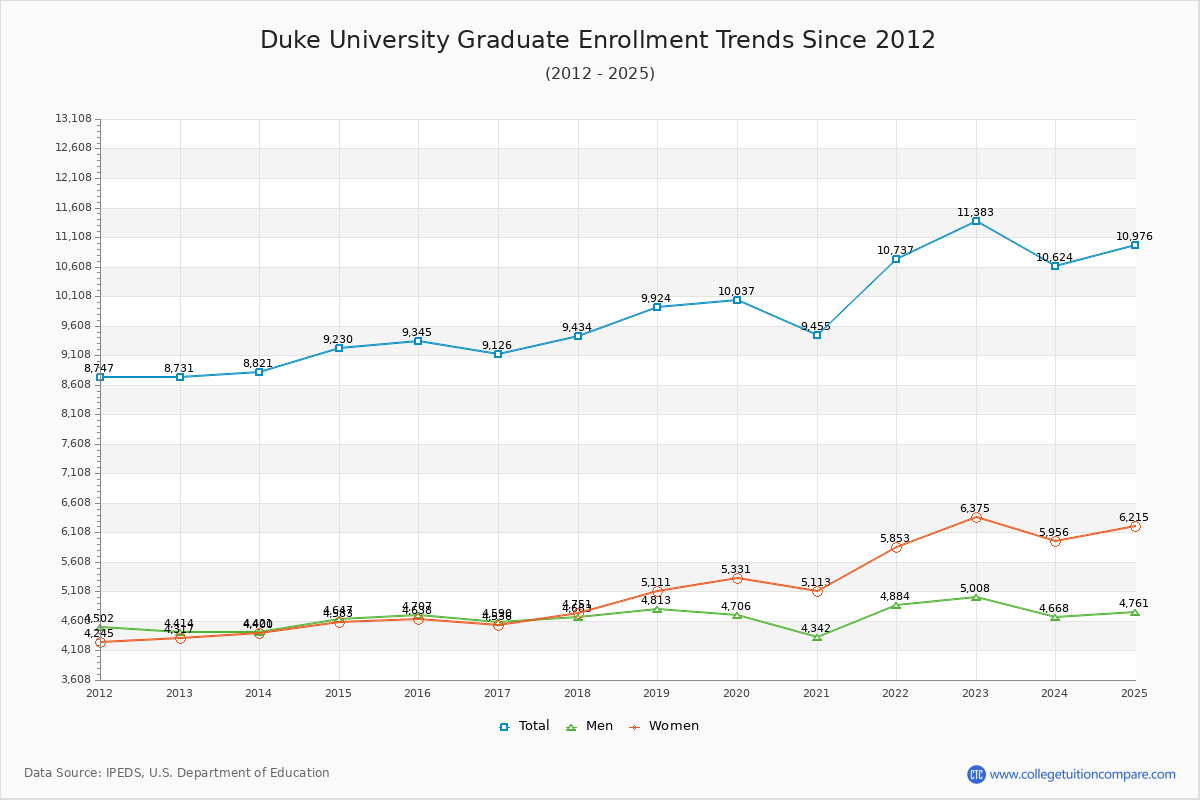
36.84% of total students is undergraduate students and 63.16% students is graduate students. The number of undergraduate students has decreased by 15 and the graduate enrollment has increased by 2,652 over past 10 years.
The female to male ratio is 1.21 to 1 and it means that there are slightly more female students enrolled in Duke than male students.
The following table and chart illustrate the changes in student population by gender at Duke University since 2012.
| Year | Total | Undergraduate | Graduate | ||||
|---|---|---|---|---|---|---|---|
| Total | Men | Women | Total | Men | Women | ||
| 2012-13 | 15,386 | 6,655 | 3,313 | 3,342 | 8,731 | 4,414 | 4,317 |
| 2013-14 | 15,467 81 | 6,646 -9 | 3,291 -22 | 3,355 13 | 8,821 90 | 4,421 7 | 4,400 83 |
| 2014-15 | 15,856 389 | 6,626 -20 | 3,318 27 | 3,308 -47 | 9,230 409 | 4,647 226 | 4,583 183 |
| 2015-16 | 15,984 128 | 6,639 13 | 3,387 69 | 3,252 -56 | 9,345 115 | 4,707 60 | 4,638 55 |
| 2016-17 | 15,735 -249 | 6,609 -30 | 3,321 -66 | 3,288 36 | 9,126 -219 | 4,590 -117 | 4,536 -102 |
| 2017-18 | 16,130 395 | 6,696 87 | 3,333 12 | 3,363 75 | 9,434 308 | 4,683 93 | 4,751 215 |
| 2018-19 | 16,606 476 | 6,682 -14 | 3,324 -9 | 3,358 -5 | 9,924 490 | 4,813 130 | 5,111 360 |
| 2019-20 | 16,686 80 | 6,649 -33 | 3,290 -34 | 3,359 1 | 10,037 113 | 4,706 -107 | 5,331 220 |
| 2020-21 | 16,172 -514 | 6,717 68 | 3,315 25 | 3,402 43 | 9,455 -582 | 4,342 -364 | 5,113 -218 |
| 2021-22 | 17,620 1,448 | 6,883 166 | 3,329 14 | 3,554 152 | 10,737 1,282 | 4,884 542 | 5,853 740 |
| 2022-23 | 18,023 403 | 6,640 -243 | 3,153 -176 | 3,487 -67 | 11,383 646 | 5,008 124 | 6,375 522 |
| Average | 16,333 | 6,677 | 3,307 | 3,370 | 9,657 | 4,656 | 5,001 |