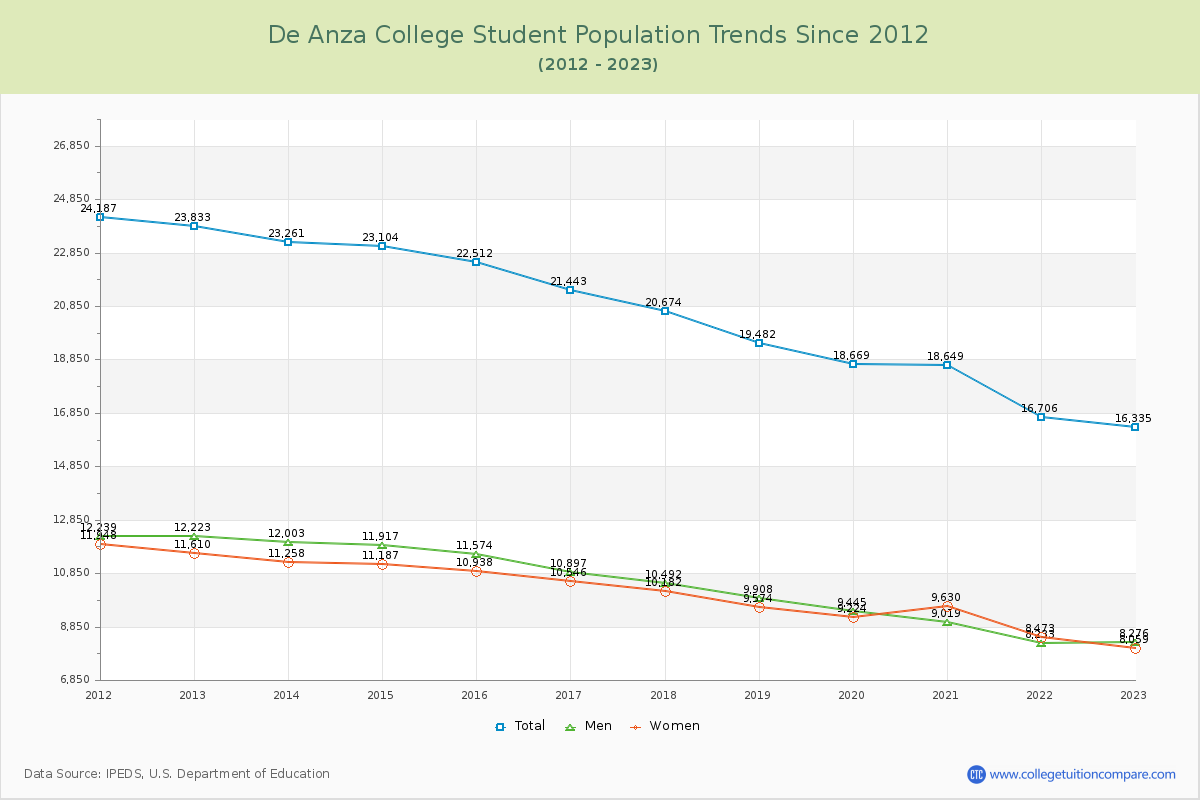
Student Population Changes
The average student population over the last 12 years is 20,424 where 16,335 students are attending the school for the academic year 2022-2023.
The female to male ratio is 0.97 to 1 and it means that there are similar numbers of female and male students enrolled in De Anza.
The following table and chart illustrate the changes in student population by gender at De Anza College since 2012.
| Year | Total | Men | Women |
|---|---|---|---|
| 2012-13 | 23,833 | 12,223 | 11,610 |
| 2013-14 | 23,261 -572 | 12,003 -220 | 11,258 -352 |
| 2014-15 | 23,104 -157 | 11,917 -86 | 11,187 -71 |
| 2015-16 | 22,512 -592 | 11,574 -343 | 10,938 -249 |
| 2016-17 | 21,443 -1,069 | 10,897 -677 | 10,546 -392 |
| 2017-18 | 20,674 -769 | 10,492 -405 | 10,182 -364 |
| 2018-19 | 19,482 -1,192 | 9,908 -584 | 9,574 -608 |
| 2019-20 | 18,669 -813 | 9,445 -463 | 9,224 -350 |
| 2020-21 | 18,649 -20 | 9,019 -426 | 9,630 406 |
| 2021-22 | 16,706 -1,943 | 8,233 -786 | 8,473 -1,157 |
| 2022-23 | 16,335 -371 | 8,276 43 | 8,059 -414 |
| Average | 20,424 | 10,362 | 10,062 |