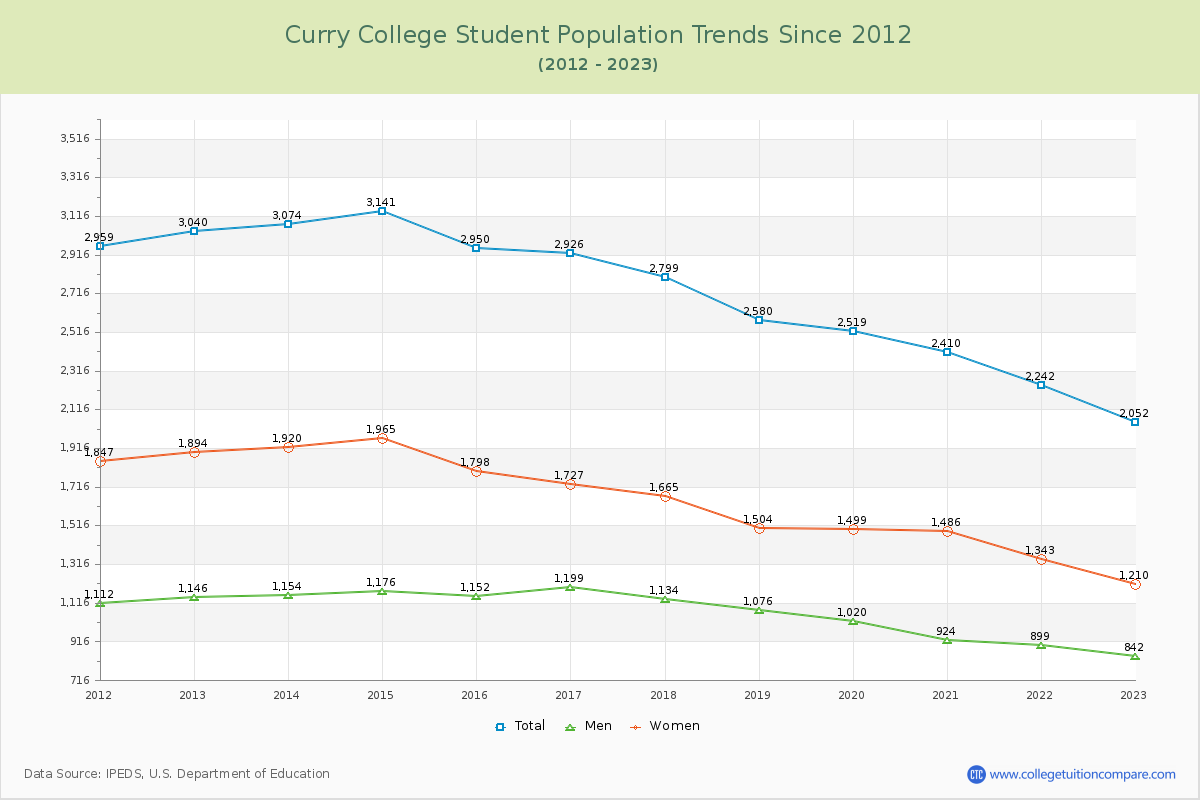
Student Population Changes
The average student population over the last 12 years is 2,703 where 2,052 students are attending the school for the academic year 2022-2023.
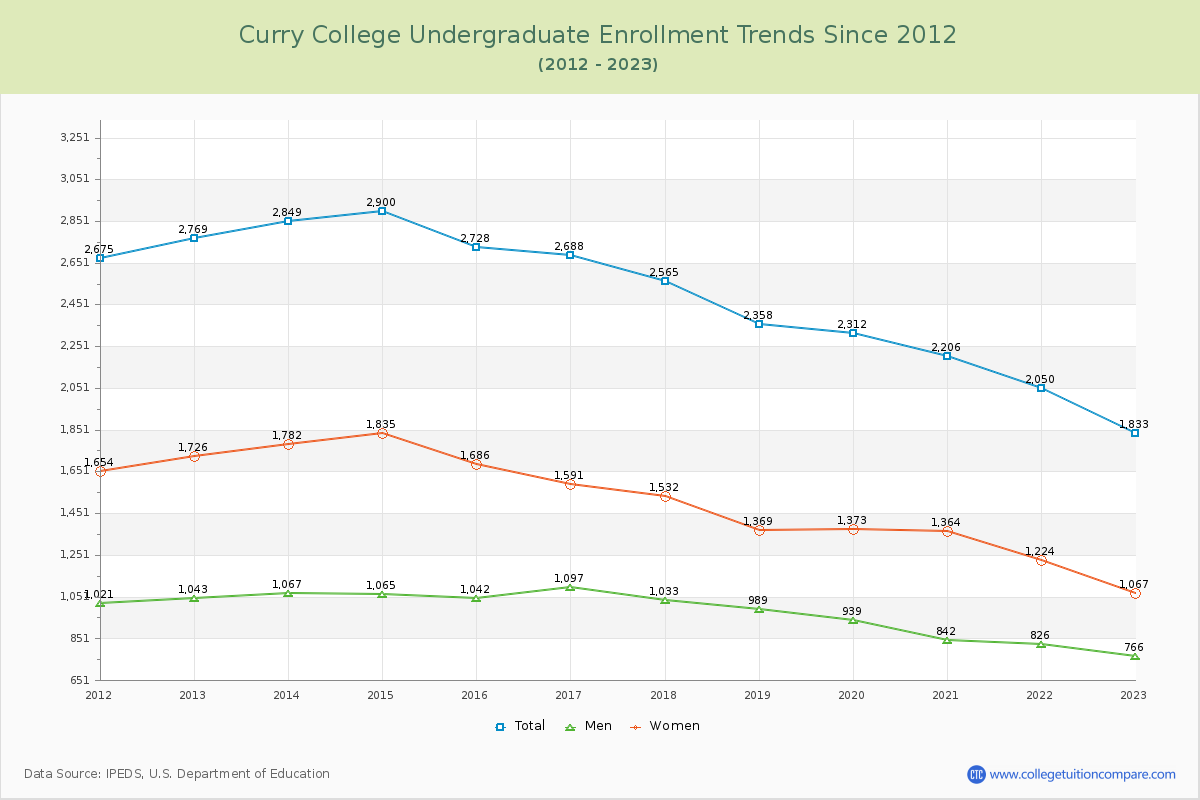
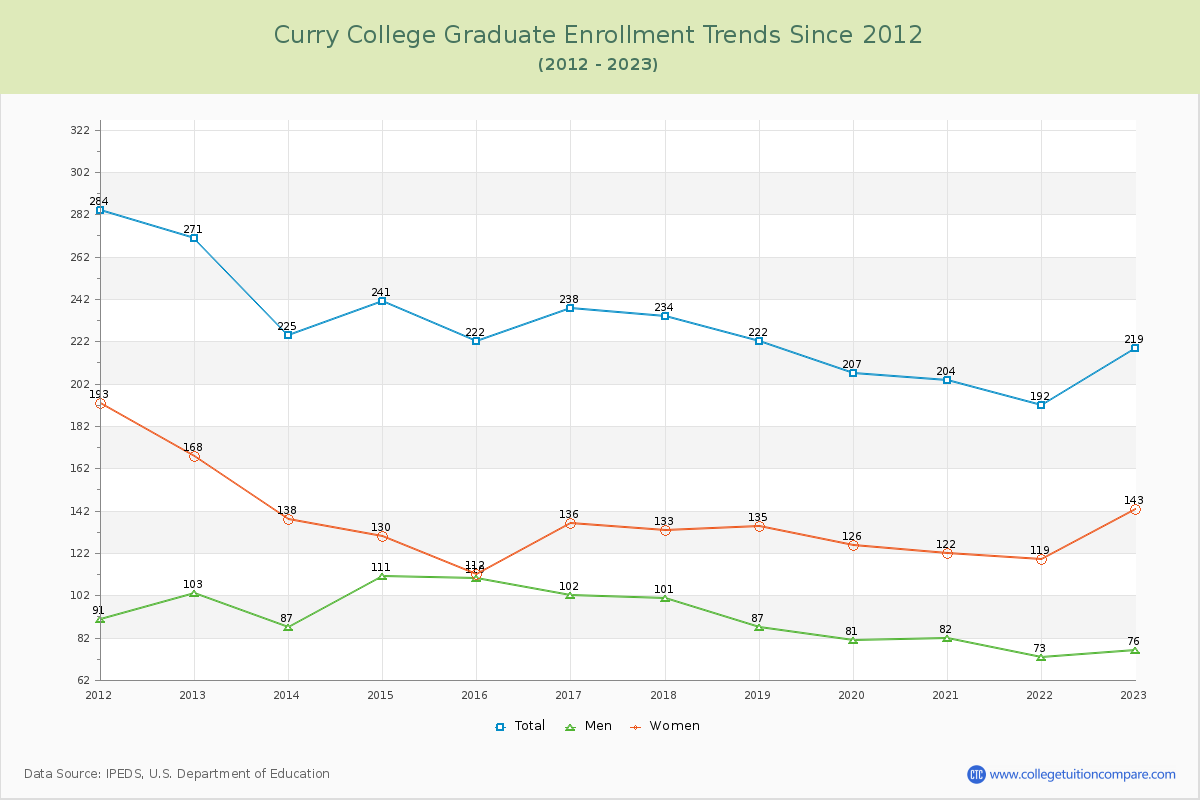
89.33% of total students is undergraduate students and 10.67% students is graduate students. The number of undergraduate students has decreased by 936 and the graduate enrollment has decreased by 52 over past 10 years.
The female to male ratio is 1.44 to 1 and it means that there are more female students enrolled in Curry than male students.
The following table and chart illustrate the changes in student population by gender at Curry College since 2012.
| Year | Total | Undergraduate | Graduate | ||||
|---|---|---|---|---|---|---|---|
| Total | Men | Women | Total | Men | Women | ||
| 2012-13 | 3,040 | 2,769 | 1,043 | 1,726 | 271 | 103 | 168 |
| 2013-14 | 3,074 34 | 2,849 80 | 1,067 24 | 1,782 56 | 225 -46 | 87 -16 | 138 -30 |
| 2014-15 | 3,141 67 | 2,900 51 | 1,065 -2 | 1,835 53 | 241 16 | 111 24 | 130 -8 |
| 2015-16 | 2,950 -191 | 2,728 -172 | 1,042 -23 | 1,686 -149 | 222 -19 | 110 -1 | 112 -18 |
| 2016-17 | 2,926 -24 | 2,688 -40 | 1,097 55 | 1,591 -95 | 238 16 | 102 -8 | 136 24 |
| 2017-18 | 2,799 -127 | 2,565 -123 | 1,033 -64 | 1,532 -59 | 234 -4 | 101 -1 | 133 -3 |
| 2018-19 | 2,580 -219 | 2,358 -207 | 989 -44 | 1,369 -163 | 222 -12 | 87 -14 | 135 2 |
| 2019-20 | 2,519 -61 | 2,312 -46 | 939 -50 | 1,373 4 | 207 -15 | 81 -6 | 126 -9 |
| 2020-21 | 2,410 -109 | 2,206 -106 | 842 -97 | 1,364 -9 | 204 -3 | 82 1 | 122 -4 |
| 2021-22 | 2,242 -168 | 2,050 -156 | 826 -16 | 1,224 -140 | 192 -12 | 73 -9 | 119 -3 |
| 2022-23 | 2,052 -190 | 1,833 -217 | 766 -60 | 1,067 -157 | 219 27 | 76 3 | 143 24 |
| Average | 2,703 | 2,478 | 974 | 1,504 | 225 | 92 | 133 |