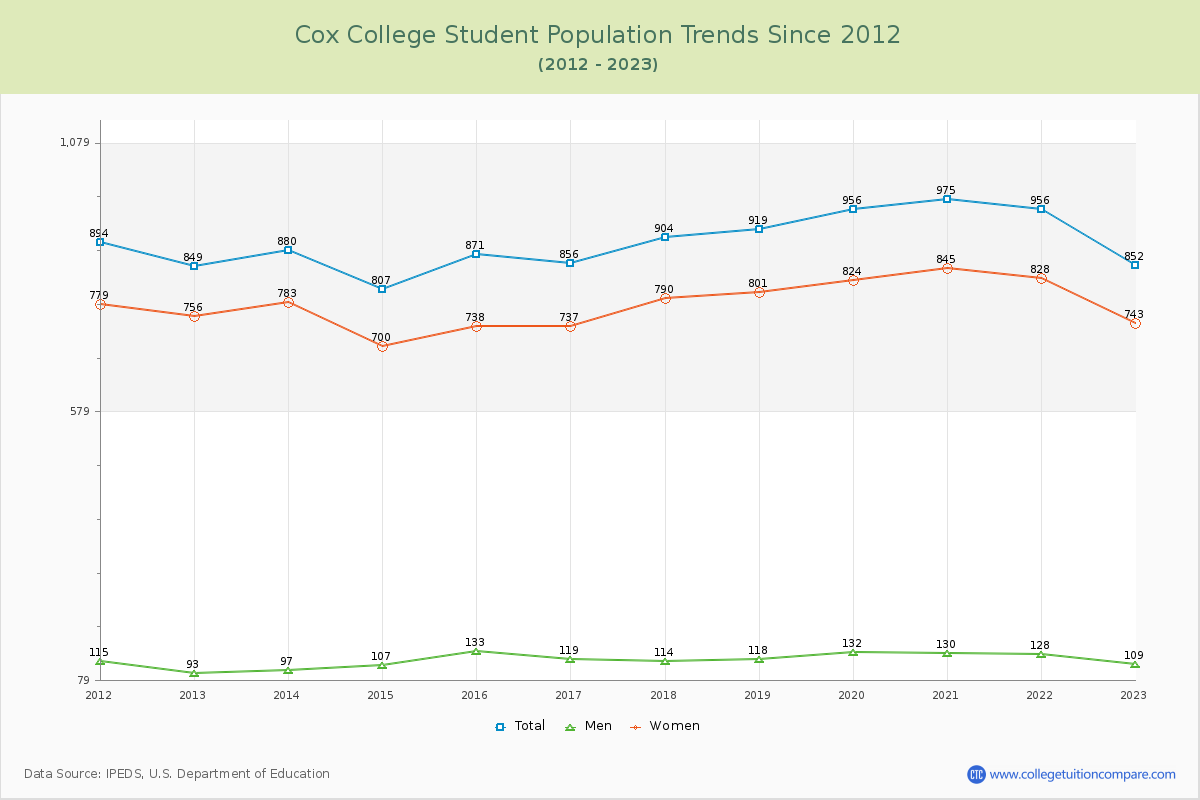
Student Population Changes
The average student population over the last 12 years is 893 where 852 students are attending the school for the academic year 2022-2023.
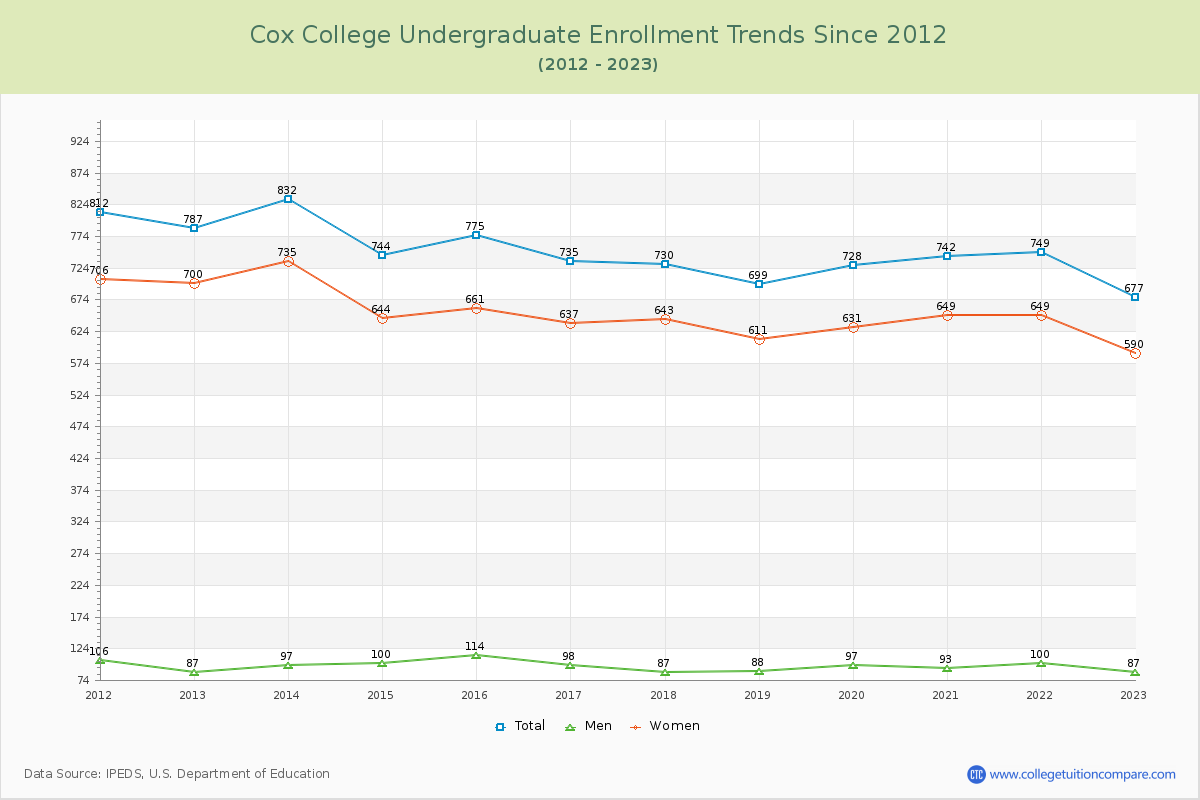
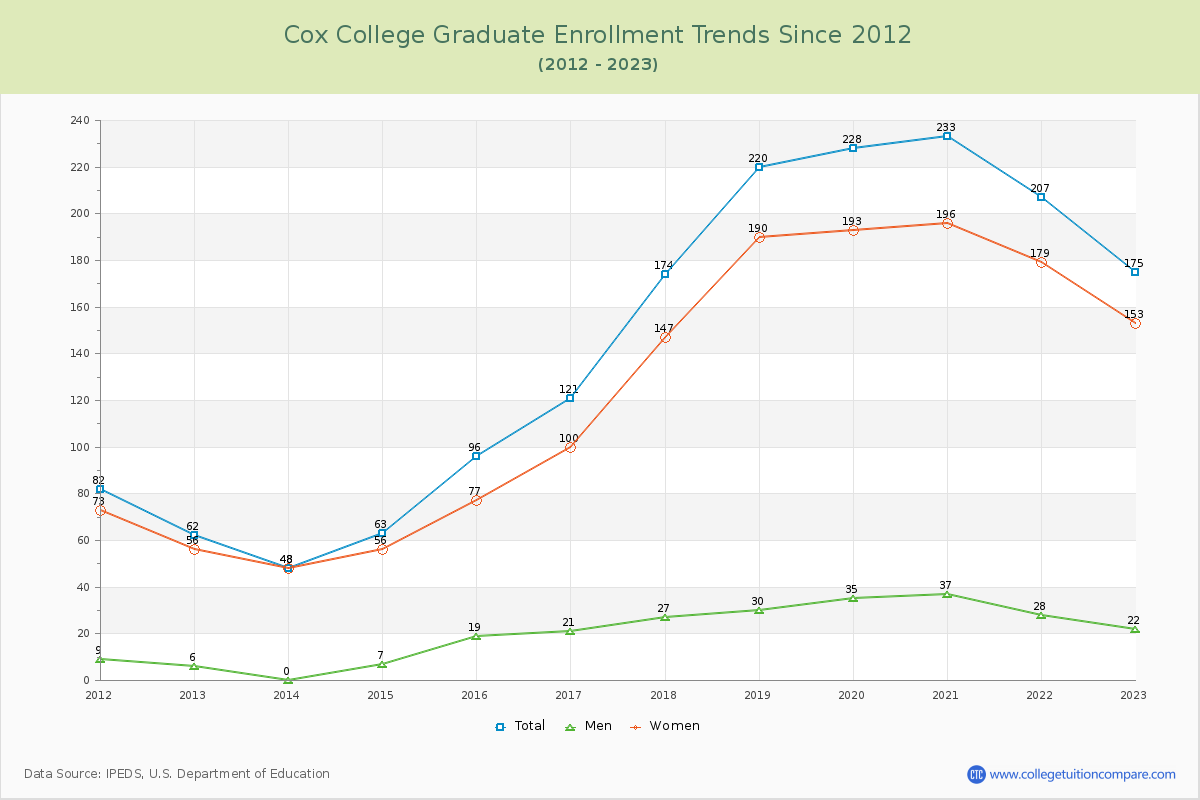
79.46% of total students is undergraduate students and 20.54% students is graduate students. The number of undergraduate students has decreased by 110 and the graduate enrollment has increased by 113 over past 10 years.
The female to male ratio is 6.82 to 1 and it means that there are far more female students enrolled in Cox than male students.
The following table and chart illustrate the changes in student population by gender at Cox College since 2012.
| Year | Total | Undergraduate | Graduate | ||||
|---|---|---|---|---|---|---|---|
| Total | Men | Women | Total | Men | Women | ||
| 2012-13 | 849 | 787 | 87 | 700 | 62 | 6 | 56 |
| 2013-14 | 880 31 | 832 45 | 97 10 | 735 35 | 48 -14 | 0 -6 | 48 -8 |
| 2014-15 | 807 -73 | 744 -88 | 100 3 | 644 -91 | 63 15 | 7 7 | 56 8 |
| 2015-16 | 871 64 | 775 31 | 114 14 | 661 17 | 96 33 | 19 12 | 77 21 |
| 2016-17 | 856 -15 | 735 -40 | 98 -16 | 637 -24 | 121 25 | 21 2 | 100 23 |
| 2017-18 | 904 48 | 730 -5 | 87 -11 | 643 6 | 174 53 | 27 6 | 147 47 |
| 2018-19 | 919 15 | 699 -31 | 88 1 | 611 -32 | 220 46 | 30 3 | 190 43 |
| 2019-20 | 956 37 | 728 29 | 97 9 | 631 20 | 228 8 | 35 5 | 193 3 |
| 2020-21 | 975 19 | 742 14 | 93 -4 | 649 18 | 233 5 | 37 2 | 196 3 |
| 2021-22 | 956 -19 | 749 7 | 100 7 | 649 0 | 207 -26 | 28 -9 | 179 -17 |
| 2022-23 | 852 -104 | 677 -72 | 87 -13 | 590 -59 | 175 -32 | 22 -6 | 153 -26 |
| Average | 893 | 745 | 95 | 650 | 148 | 21 | 127 |