Student Population Changes
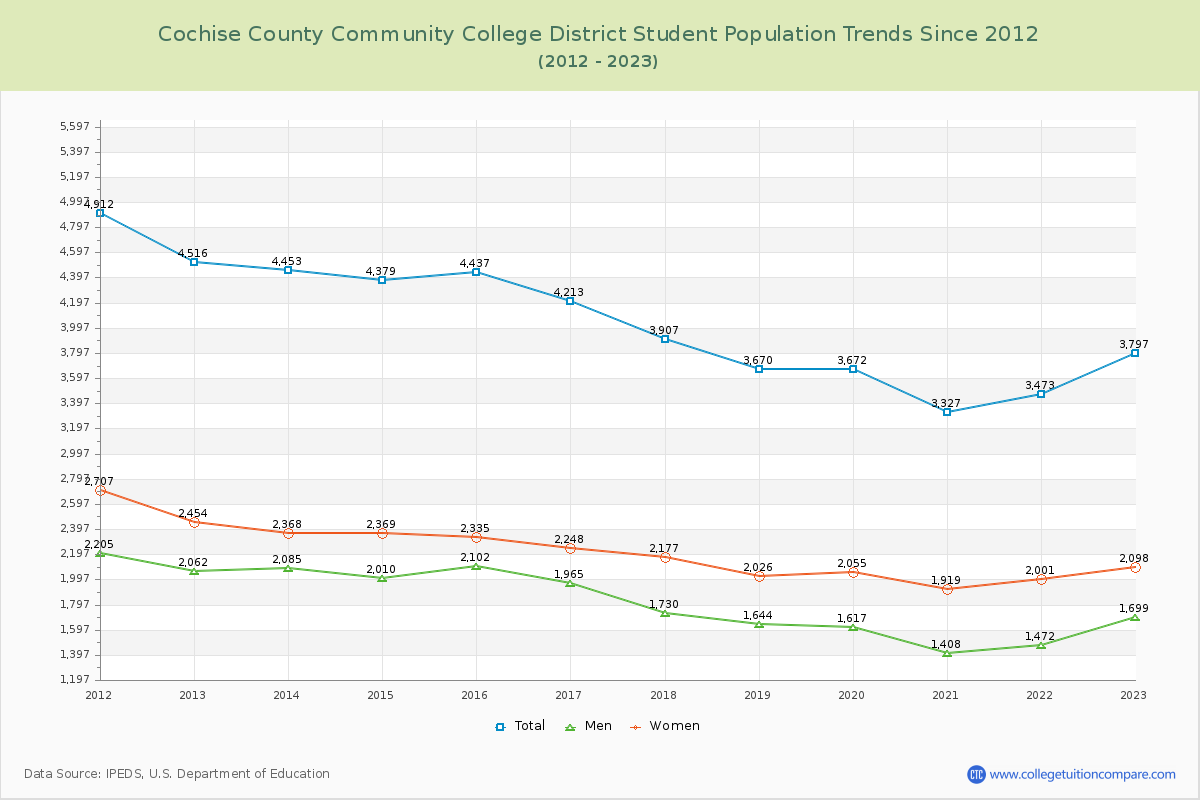
The average student population over the last 12 years is 3,986 where 3,797 students are attending the school for the academic year 2022-2023.
The female to male ratio is 1.23 to 1 and it means that there are slightly more female students enrolled in Cochise College than male students.
The following table and chart illustrate the changes in student population by gender at Cochise County Community College District since 2012.
| Year | Total | Men | Women |
|---|---|---|---|
| 2012-13 | 4,516 | 2,062 | 2,454 |
| 2013-14 | 4,453 -63 | 2,085 23 | 2,368 -86 |
| 2014-15 | 4,379 -74 | 2,010 -75 | 2,369 1 |
| 2015-16 | 4,437 58 | 2,102 92 | 2,335 -34 |
| 2016-17 | 4,213 -224 | 1,965 -137 | 2,248 -87 |
| 2017-18 | 3,907 -306 | 1,730 -235 | 2,177 -71 |
| 2018-19 | 3,670 -237 | 1,644 -86 | 2,026 -151 |
| 2019-20 | 3,672 2 | 1,617 -27 | 2,055 29 |
| 2020-21 | 3,327 -345 | 1,408 -209 | 1,919 -136 |
| 2021-22 | 3,473 146 | 1,472 64 | 2,001 82 |
| 2022-23 | 3,797 324 | 1,699 227 | 2,098 97 |
| Average | 3,986 | 1,799 | 2,186 |