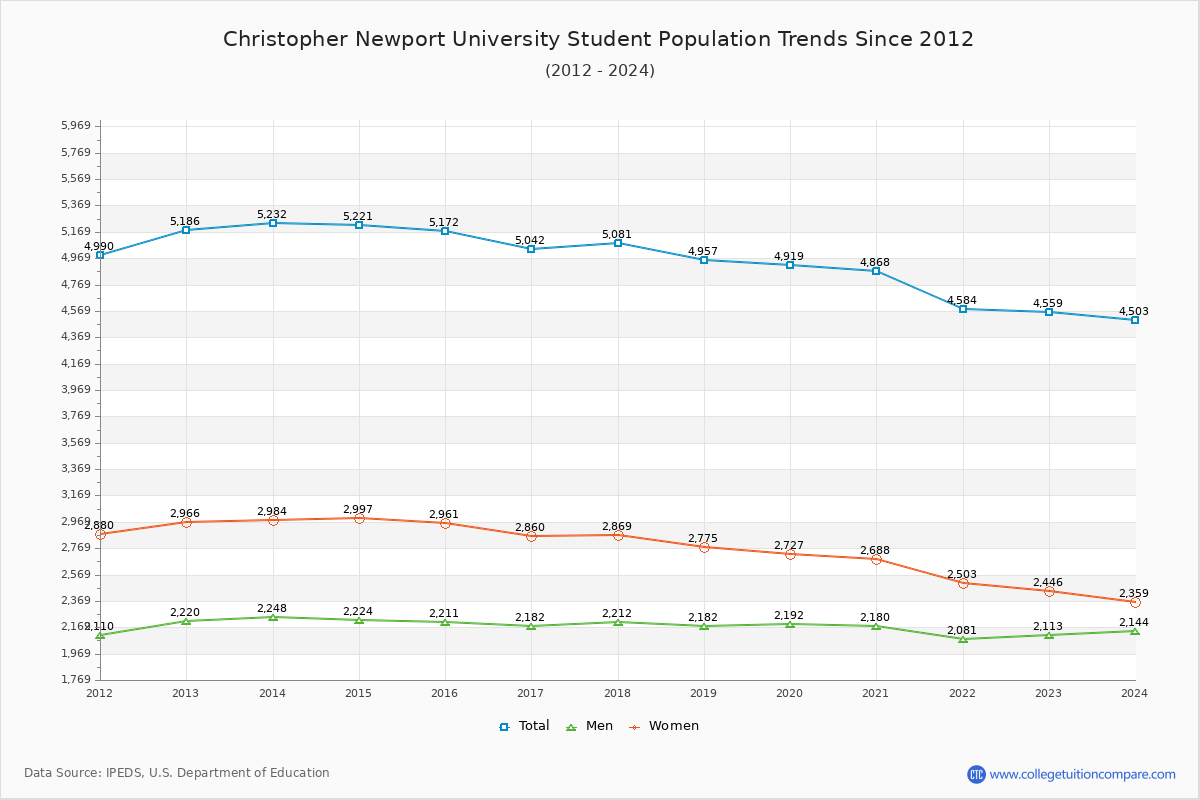
Student Population Changes
The average student population over the last 12 years is 4,984 where 4,559 students are attending the school for the academic year 2022-2023.
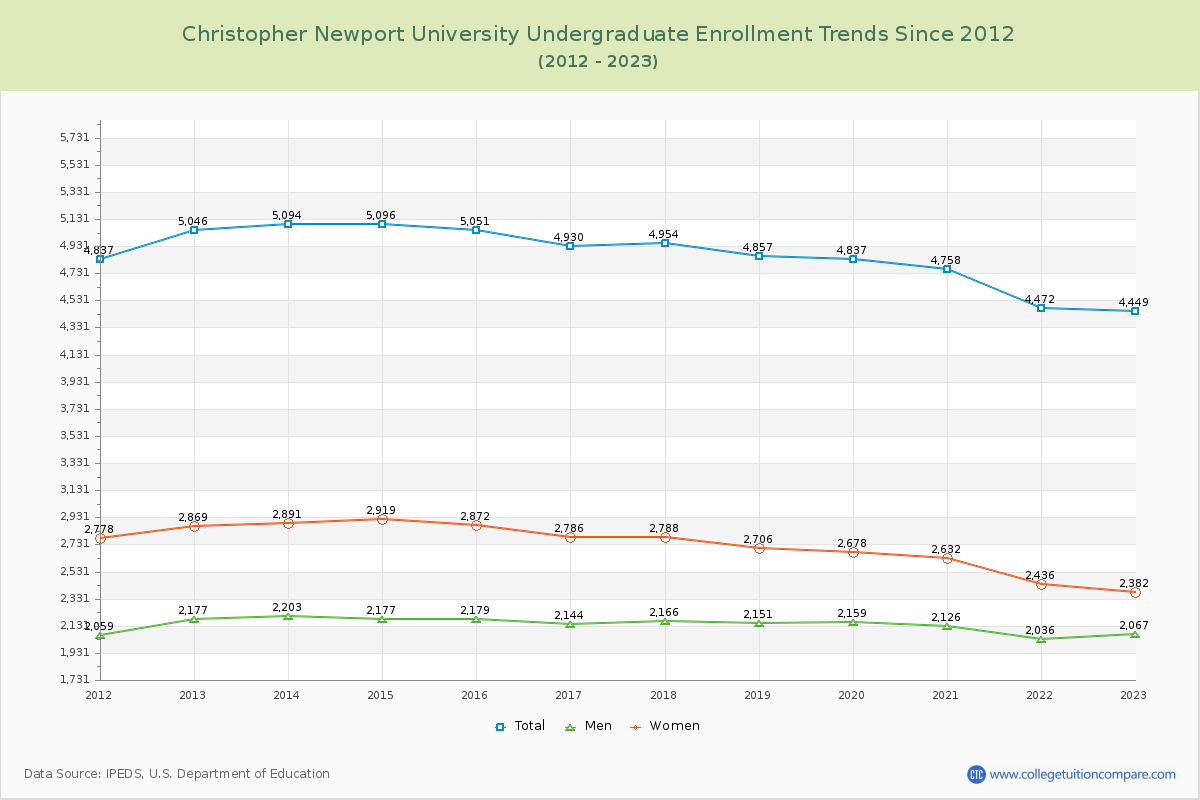
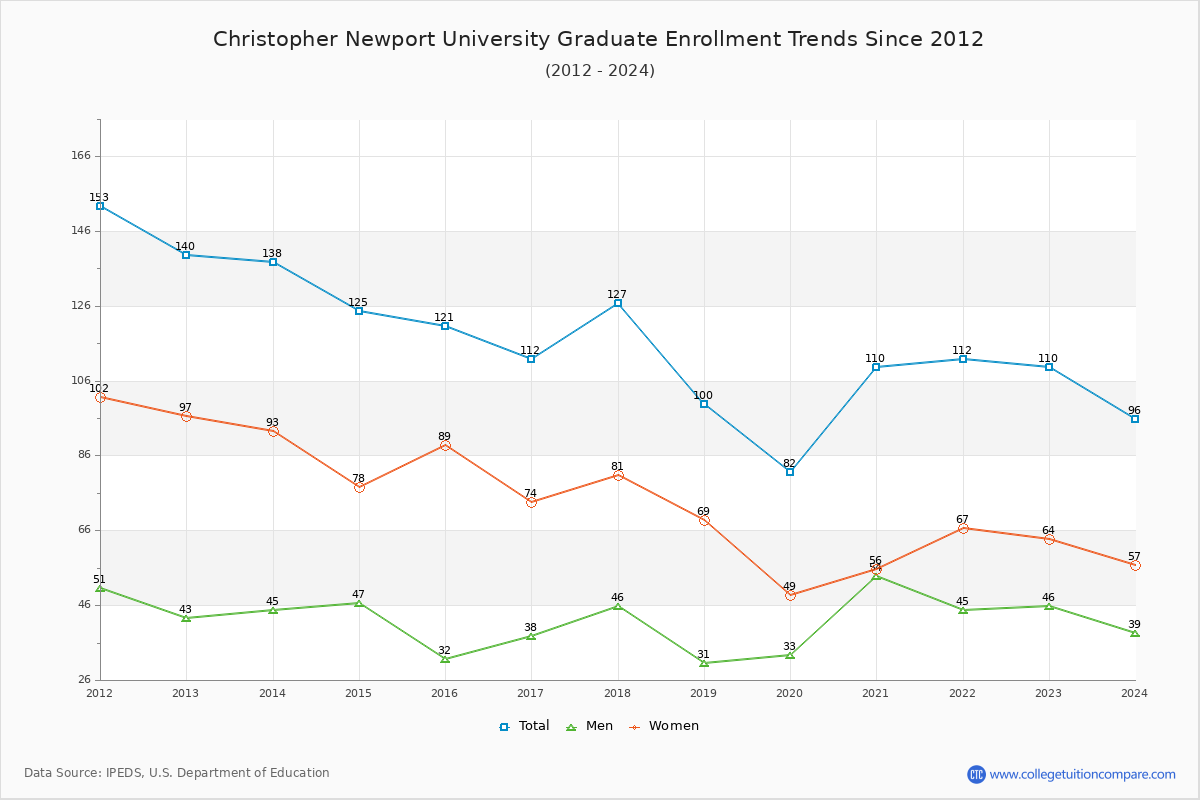
97.59% of total students is undergraduate students and 2.41% students is graduate students. The number of undergraduate students has decreased by 597 and the graduate enrollment has decreased by 30 over past 10 years.
The female to male ratio is 1.16 to 1 and it means that there are slightly more female students enrolled in CNU than male students.
The following table and chart illustrate the changes in student population by gender at Christopher Newport University since 2012.
| Year | Total | Undergraduate | Graduate | ||||
|---|---|---|---|---|---|---|---|
| Total | Men | Women | Total | Men | Women | ||
| 2012-13 | 5,186 | 5,046 | 2,177 | 2,869 | 140 | 43 | 97 |
| 2013-14 | 5,232 46 | 5,094 48 | 2,203 26 | 2,891 22 | 138 -2 | 45 2 | 93 -4 |
| 2014-15 | 5,221 -11 | 5,096 2 | 2,177 -26 | 2,919 28 | 125 -13 | 47 2 | 78 -15 |
| 2015-16 | 5,172 -49 | 5,051 -45 | 2,179 2 | 2,872 -47 | 121 -4 | 32 -15 | 89 11 |
| 2016-17 | 5,042 -130 | 4,930 -121 | 2,144 -35 | 2,786 -86 | 112 -9 | 38 6 | 74 -15 |
| 2017-18 | 5,081 39 | 4,954 24 | 2,166 22 | 2,788 2 | 127 15 | 46 8 | 81 7 |
| 2018-19 | 4,957 -124 | 4,857 -97 | 2,151 -15 | 2,706 -82 | 100 -27 | 31 -15 | 69 -12 |
| 2019-20 | 4,919 -38 | 4,837 -20 | 2,159 8 | 2,678 -28 | 82 -18 | 33 2 | 49 -20 |
| 2020-21 | 4,868 -51 | 4,758 -79 | 2,126 -33 | 2,632 -46 | 110 28 | 54 21 | 56 7 |
| 2021-22 | 4,584 -284 | 4,472 -286 | 2,036 -90 | 2,436 -196 | 112 2 | 45 -9 | 67 11 |
| 2022-23 | 4,559 -25 | 4,449 -23 | 2,067 31 | 2,382 -54 | 110 -2 | 46 1 | 64 -3 |
| Average | 4,984 | 4,868 | 2,144 | 2,724 | 116 | 42 | 74 |