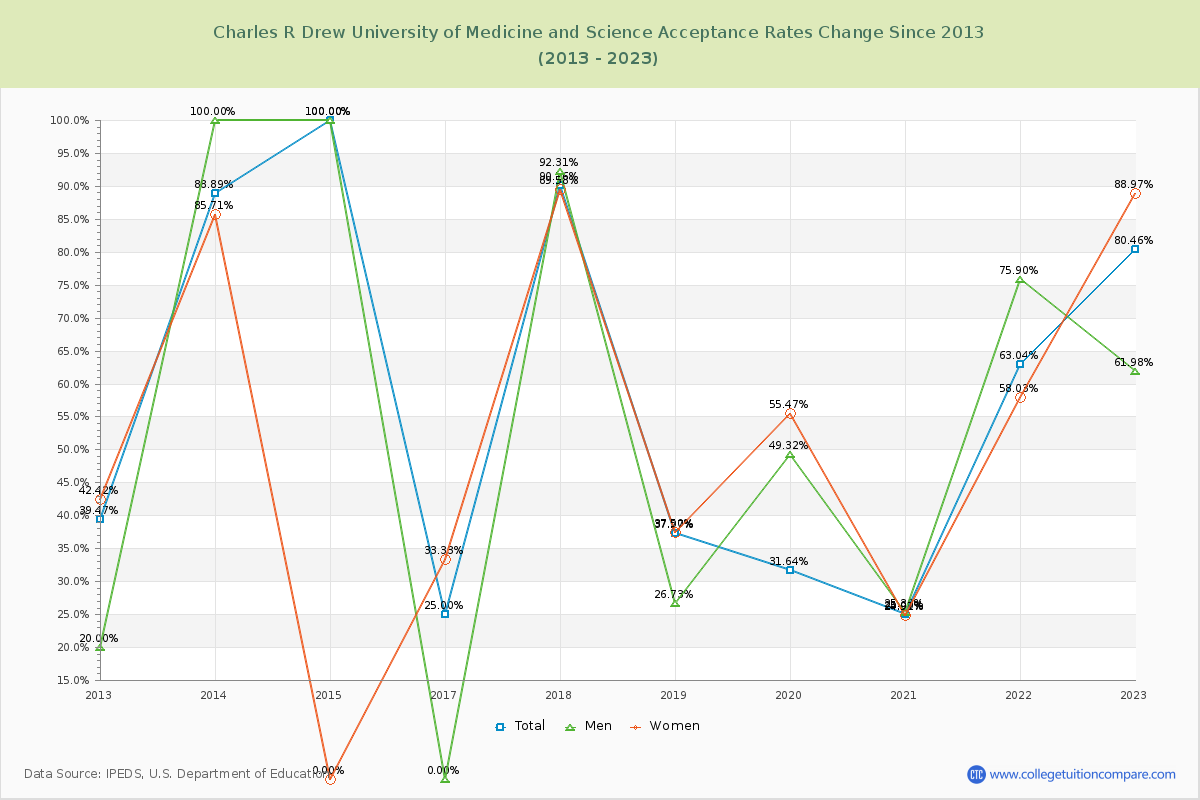
Acceptance Rate Changes
The average acceptance rate over the last 10 years is 52.81%, and this year's acceptance rate is 80.46% at Charles R Drew University of Medicine and Science. By gender, men students' acceptance rate is 50.14% and women students' rate is 46.90%. For 2023 admission, it was easier to get into Charles R Drew University of Medicine and Science than the previous year.
The next table and chart illustrate the acceptance rates changes at Charles R Drew University of Medicine and Science over the past 11 years (2012-2023).
| Year | Total | Men | Women |
|---|---|---|---|
| 2012-13 | 39.47% | 20.00% | 42.42% |
| 2013-14 | 88.89% 49.42% |
100.00% 43.29% |
85.71% 43.29% |
| 2014-15 | 100.00% 11.11% |
100.00% -85.71% |
0.00% -85.71% |
| 2015-16 | - | - | - |
| 2016-17 | 25.00% - |
0.00% - |
33.33% - |
| 2017-18 | 90.16% 65.16% |
92.31% 56.25% |
89.58% 56.25% |
| 2018-19 | 37.27% -52.90% |
26.73% -52.08% |
37.50% -52.08% |
| 2019-20 | 31.64% -5.63% |
49.32% 17.97% |
55.47% 17.97% |
| 2020-21 | 25.00% -6.64% |
25.30% -30.55% |
24.91% -30.55% |
| 2021-22 | 63.04% 38.04% |
75.90% 33.12% |
58.03% 33.12% |
| 2022-23 | 80.46% 17.42% |
61.98% 30.94% |
88.97% 30.94% |
| Average | 52.81% | 50.14% | 46.90% |