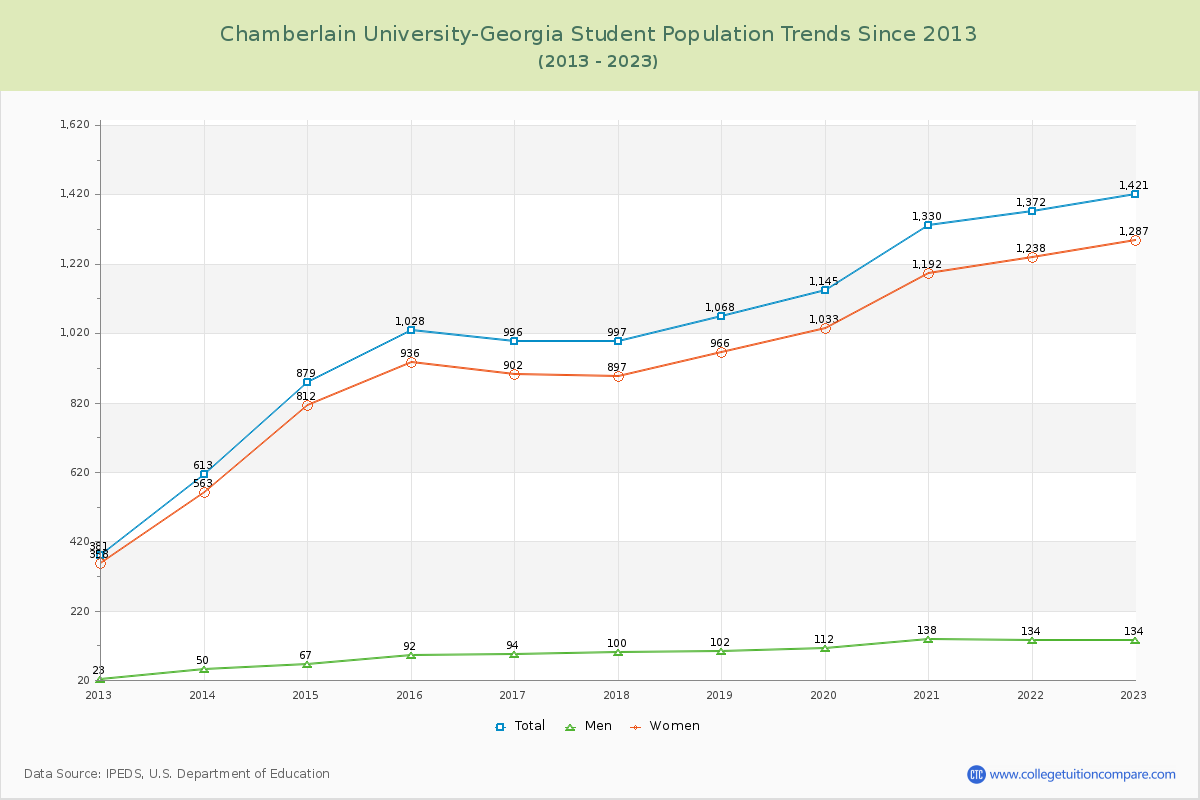
Student Population Changes
The average student population over the last 12 years is 1,021 where 1,421 students are attending the school for the academic year 2022-2023.
The female to male ratio is 9.60 to 1 and it means that there are far more female students enrolled in Chamberlain University-Georgia than male students.
The following table and chart illustrate the changes in student population by gender at Chamberlain University-Georgia since 2012.
| Year | Total | Men | Women |
|---|---|---|---|
| 2012-13 | 381 | 23 | 358 |
| 2013-14 | 613 232 | 50 27 | 563 205 |
| 2014-15 | 879 266 | 67 17 | 812 249 |
| 2015-16 | 1,028 149 | 92 25 | 936 124 |
| 2016-17 | 996 -32 | 94 2 | 902 -34 |
| 2017-18 | 997 1 | 100 6 | 897 -5 |
| 2018-19 | 1,068 71 | 102 2 | 966 69 |
| 2019-20 | 1,145 77 | 112 10 | 1,033 67 |
| 2020-21 | 1,330 185 | 138 26 | 1,192 159 |
| 2021-22 | 1,372 42 | 134 -4 | 1,238 46 |
| 2022-23 | 1,421 49 | 134 0 | 1,287 49 |
| Average | 1,021 | 95 | 926 |