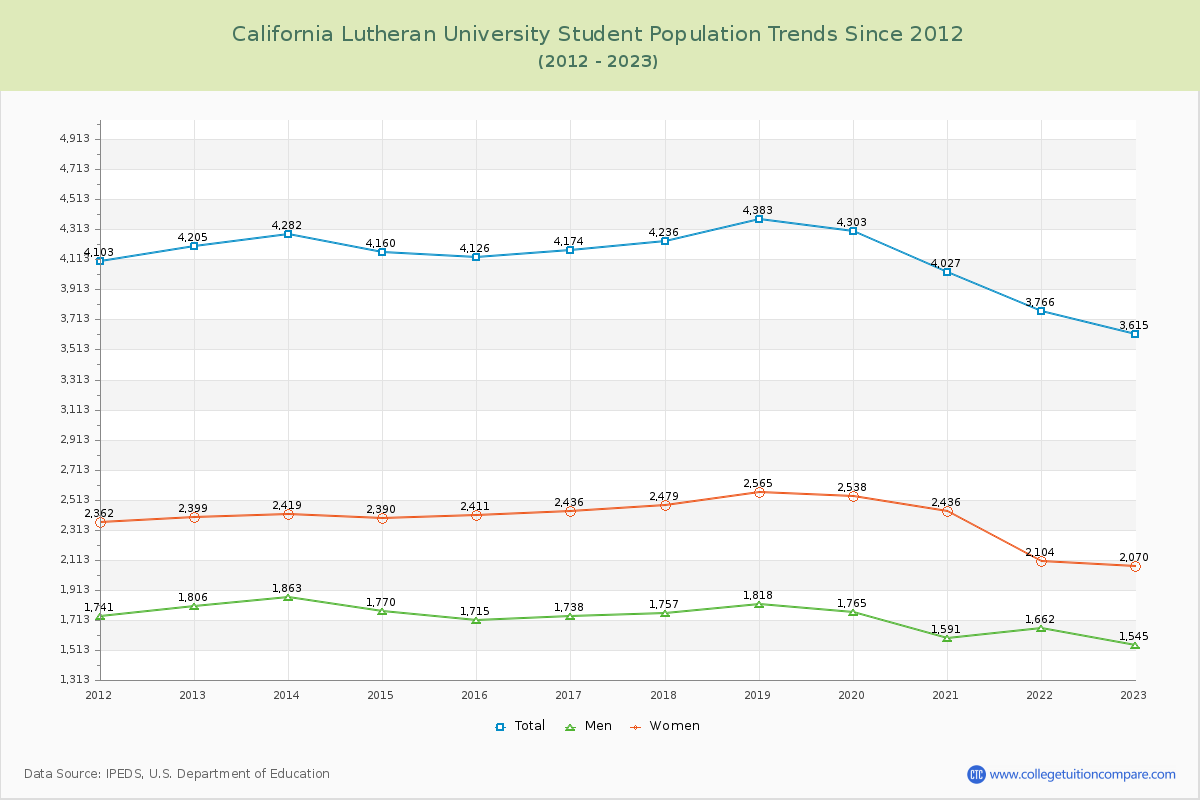
Student Population Changes
The average student population over the last 12 years is 4,116 where 3,615 students are attending the school for the academic year 2022-2023.
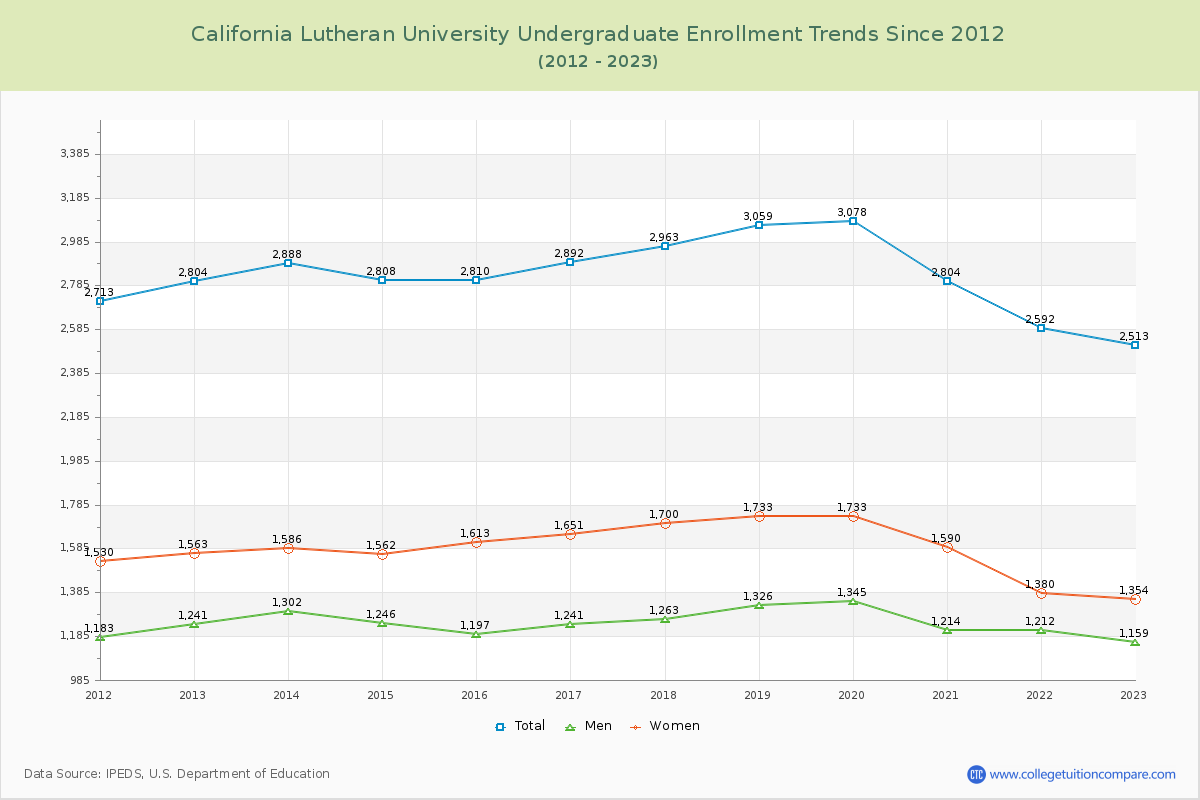
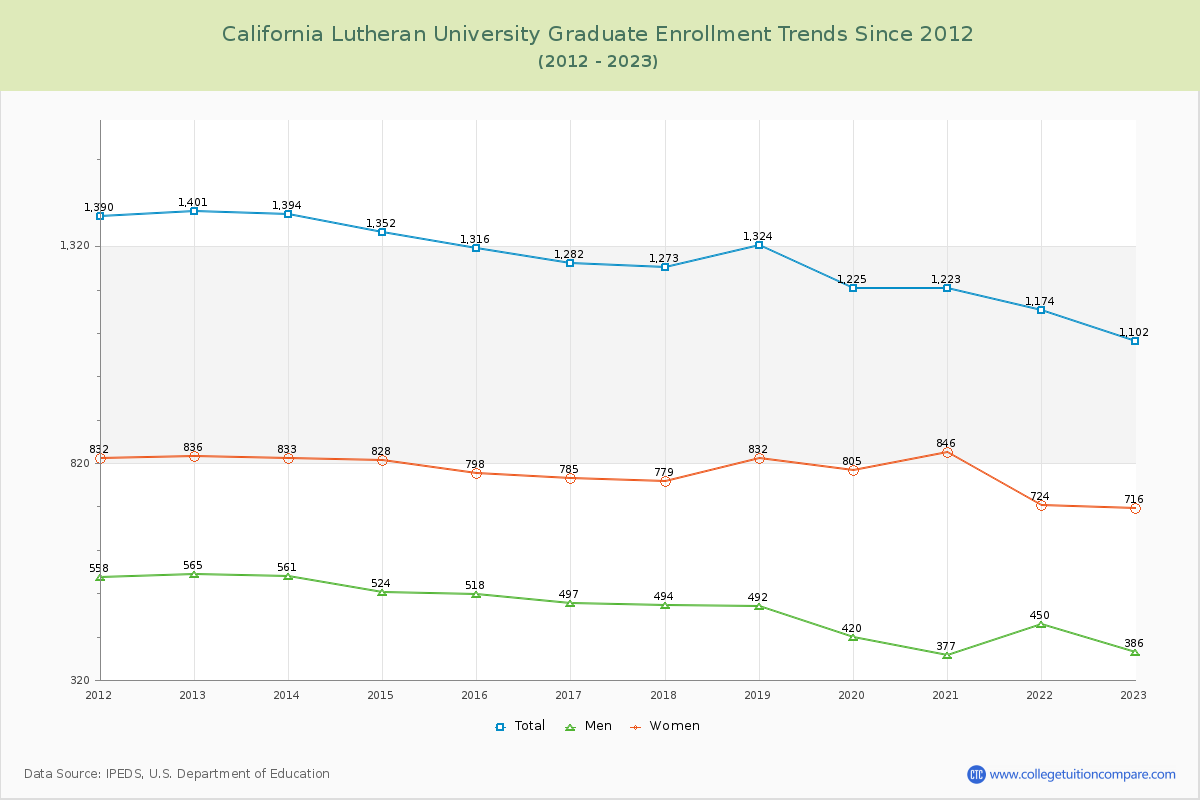
69.52% of total students is undergraduate students and 30.48% students is graduate students. The number of undergraduate students has decreased by 291 and the graduate enrollment has decreased by 299 over past 10 years.
The female to male ratio is 1.34 to 1 and it means that there are more female students enrolled in California Lutheran than male students.
The following table and chart illustrate the changes in student population by gender at California Lutheran University since 2012.
| Year | Total | Undergraduate | Graduate | ||||
|---|---|---|---|---|---|---|---|
| Total | Men | Women | Total | Men | Women | ||
| 2012-13 | 4,205 | 2,804 | 1,241 | 1,563 | 1,401 | 565 | 836 |
| 2013-14 | 4,282 77 | 2,888 84 | 1,302 61 | 1,586 23 | 1,394 -7 | 561 -4 | 833 -3 |
| 2014-15 | 4,160 -122 | 2,808 -80 | 1,246 -56 | 1,562 -24 | 1,352 -42 | 524 -37 | 828 -5 |
| 2015-16 | 4,126 -34 | 2,810 2 | 1,197 -49 | 1,613 51 | 1,316 -36 | 518 -6 | 798 -30 |
| 2016-17 | 4,174 48 | 2,892 82 | 1,241 44 | 1,651 38 | 1,282 -34 | 497 -21 | 785 -13 |
| 2017-18 | 4,236 62 | 2,963 71 | 1,263 22 | 1,700 49 | 1,273 -9 | 494 -3 | 779 -6 |
| 2018-19 | 4,383 147 | 3,059 96 | 1,326 63 | 1,733 33 | 1,324 51 | 492 -2 | 832 53 |
| 2019-20 | 4,303 -80 | 3,078 19 | 1,345 19 | 1,733 0 | 1,225 -99 | 420 -72 | 805 -27 |
| 2020-21 | 4,027 -276 | 2,804 -274 | 1,214 -131 | 1,590 -143 | 1,223 -2 | 377 -43 | 846 41 |
| 2021-22 | 3,766 -261 | 2,592 -212 | 1,212 -2 | 1,380 -210 | 1,174 -49 | 450 73 | 724 -122 |
| 2022-23 | 3,615 -151 | 2,513 -79 | 1,159 -53 | 1,354 -26 | 1,102 -72 | 386 -64 | 716 -8 |
| Average | 4,116 | 2,837 | 1,250 | 1,588 | 1,279 | 480 | 798 |