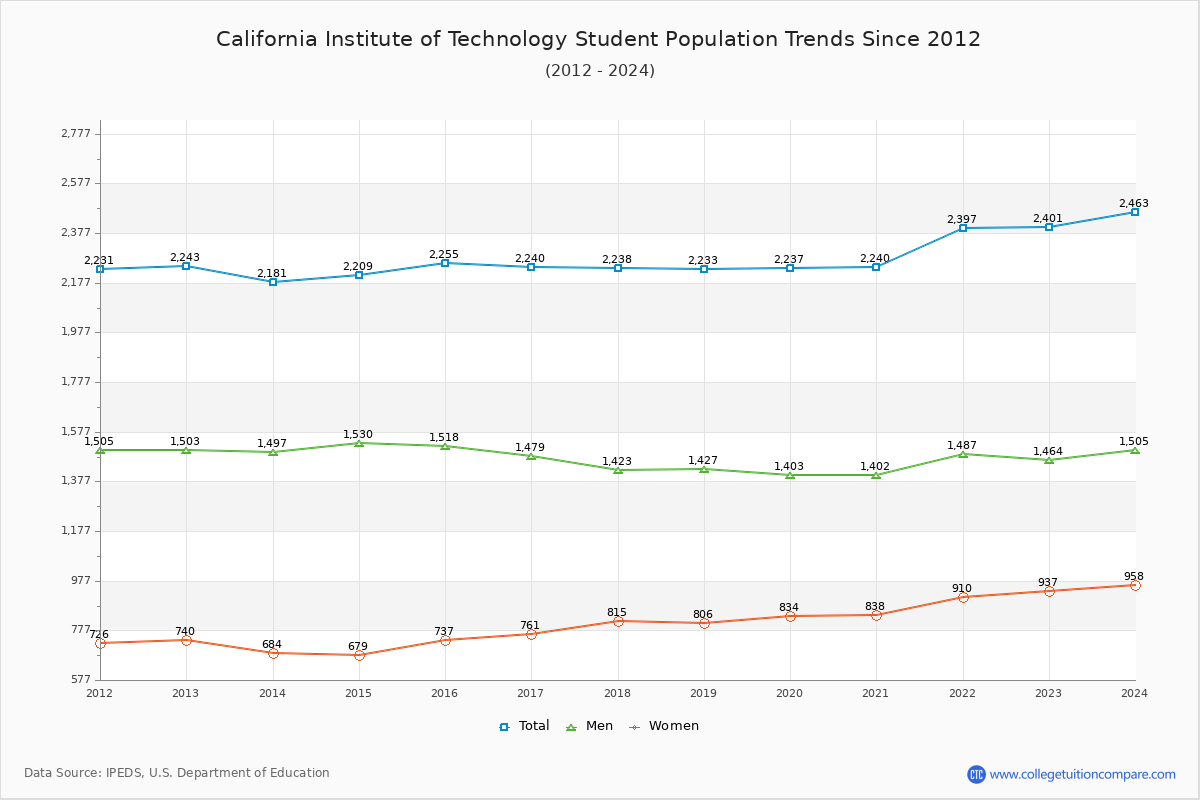
Student Population Changes
The average student population over the last 12 years is 2,261 where 2,401 students are attending the school for the academic year 2022-2023.
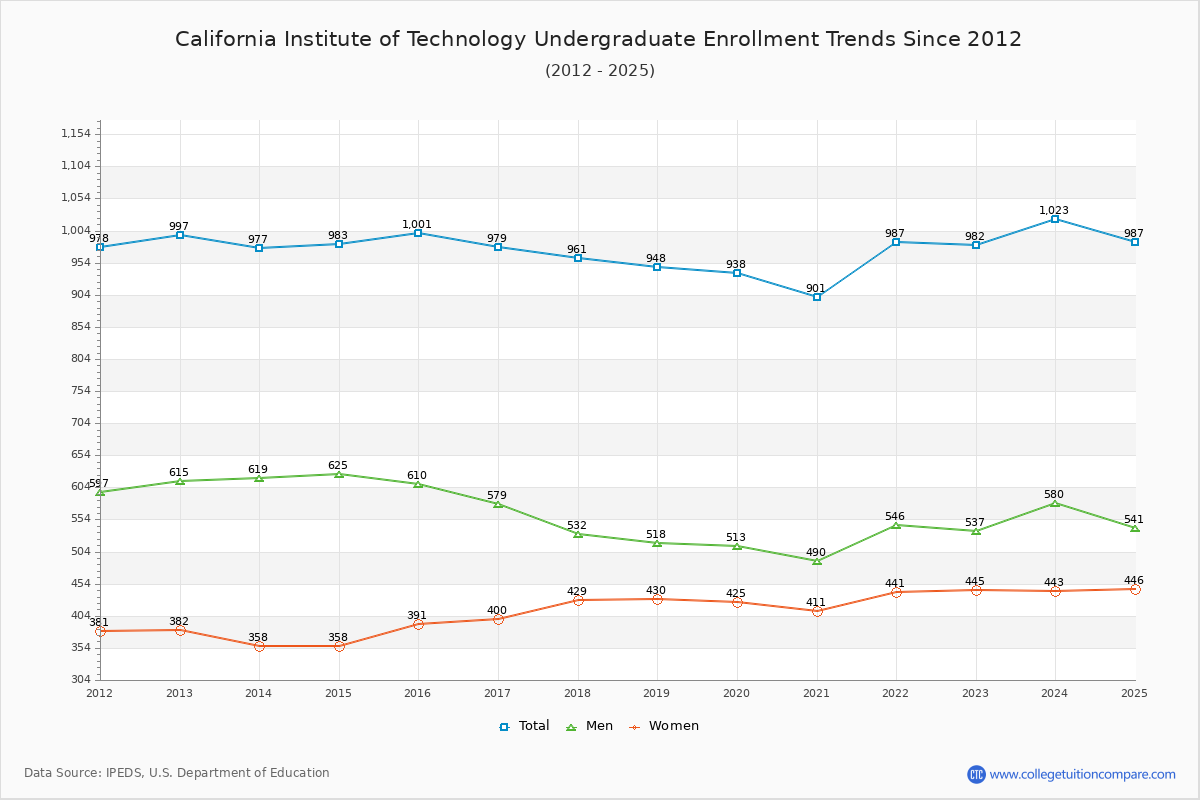
40.90% of total students is undergraduate students and 59.10% students is graduate students. The number of undergraduate students has decreased by 15 and the graduate enrollment has increased by 173 over past 10 years.
The female to male ratio is 0.64 to 1 and it means that there are more male students enrolled in Caltech than female students.
The following table and chart illustrate the changes in student population by gender at California Institute of Technology since 2012.
| Year | Total | Undergraduate | Graduate | ||||
|---|---|---|---|---|---|---|---|
| Total | Men | Women | Total | Men | Women | ||
| 2012-13 | 2,243 | 997 | 615 | 382 | 1,246 | 888 | 358 |
| 2013-14 | 2,181 -62 | 977 -20 | 619 4 | 358 -24 | 1,204 -42 | 878 -10 | 326 -32 |
| 2014-15 | 2,209 28 | 983 6 | 625 6 | 358 0 | 1,226 22 | 905 27 | 321 -5 |
| 2015-16 | 2,255 46 | 1,001 18 | 610 -15 | 391 33 | 1,254 28 | 908 3 | 346 25 |
| 2016-17 | 2,240 -15 | 979 -22 | 579 -31 | 400 9 | 1,261 7 | 900 -8 | 361 15 |
| 2017-18 | 2,238 -2 | 961 -18 | 532 -47 | 429 29 | 1,277 16 | 891 -9 | 386 25 |
| 2018-19 | 2,233 -5 | 948 -13 | 518 -14 | 430 1 | 1,285 8 | 909 18 | 376 -10 |
| 2019-20 | 2,237 4 | 938 -10 | 513 -5 | 425 -5 | 1,299 14 | 890 -19 | 409 33 |
| 2020-21 | 2,240 3 | 901 -37 | 490 -23 | 411 -14 | 1,339 40 | 912 22 | 427 18 |
| 2021-22 | 2,397 157 | 987 86 | 546 56 | 441 30 | 1,410 71 | 941 29 | 469 42 |
| 2022-23 | 2,401 4 | 982 -5 | 537 -9 | 445 4 | 1,419 9 | 927 -14 | 492 23 |
| Average | 2,261 | 969 | 562 | 406 | 1,293 | 904 | 388 |