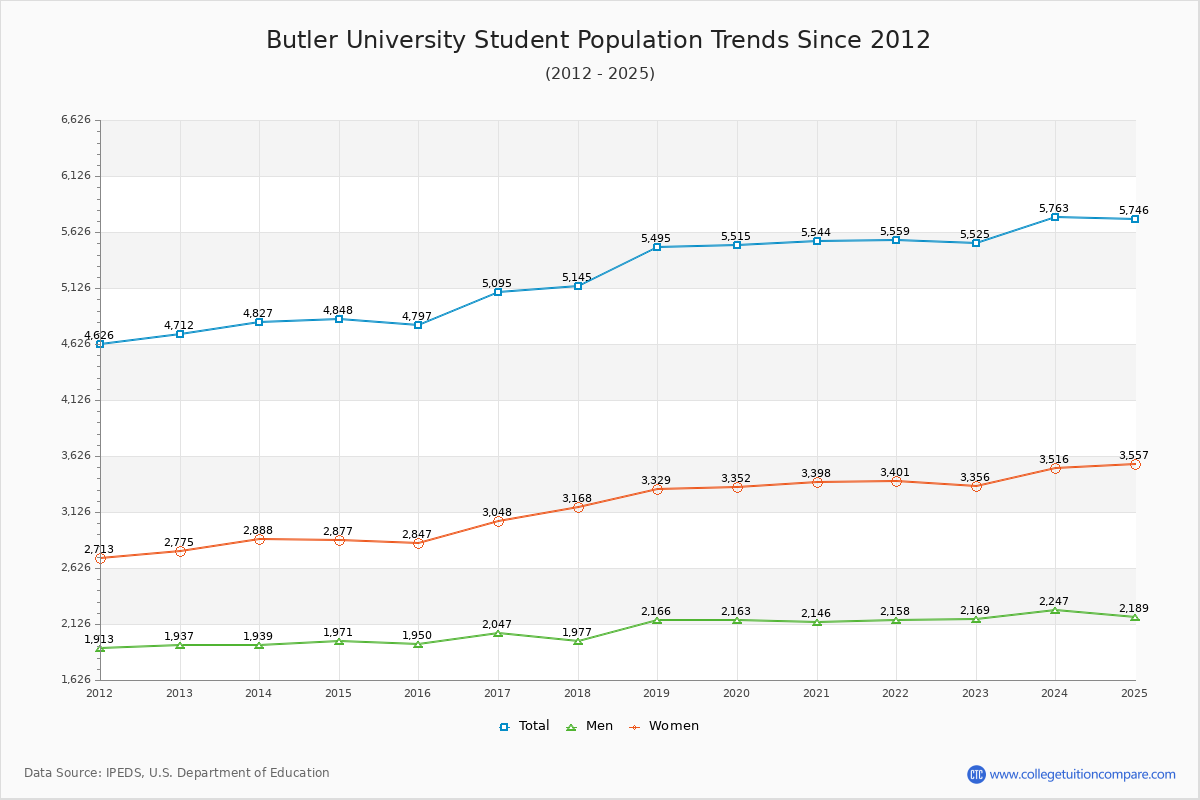
Student Population Changes
The average student population over the last 12 years is 5,187 where 5,525 students are attending the school for the academic year 2022-2023.
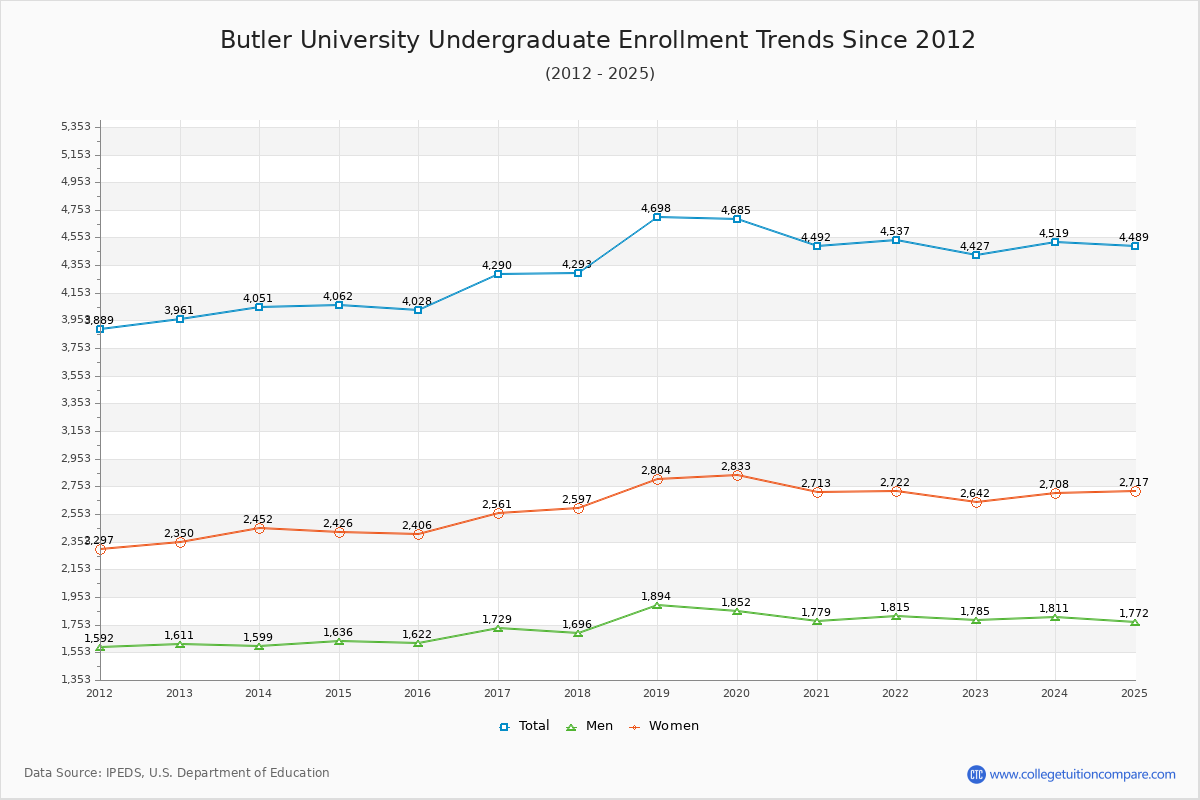
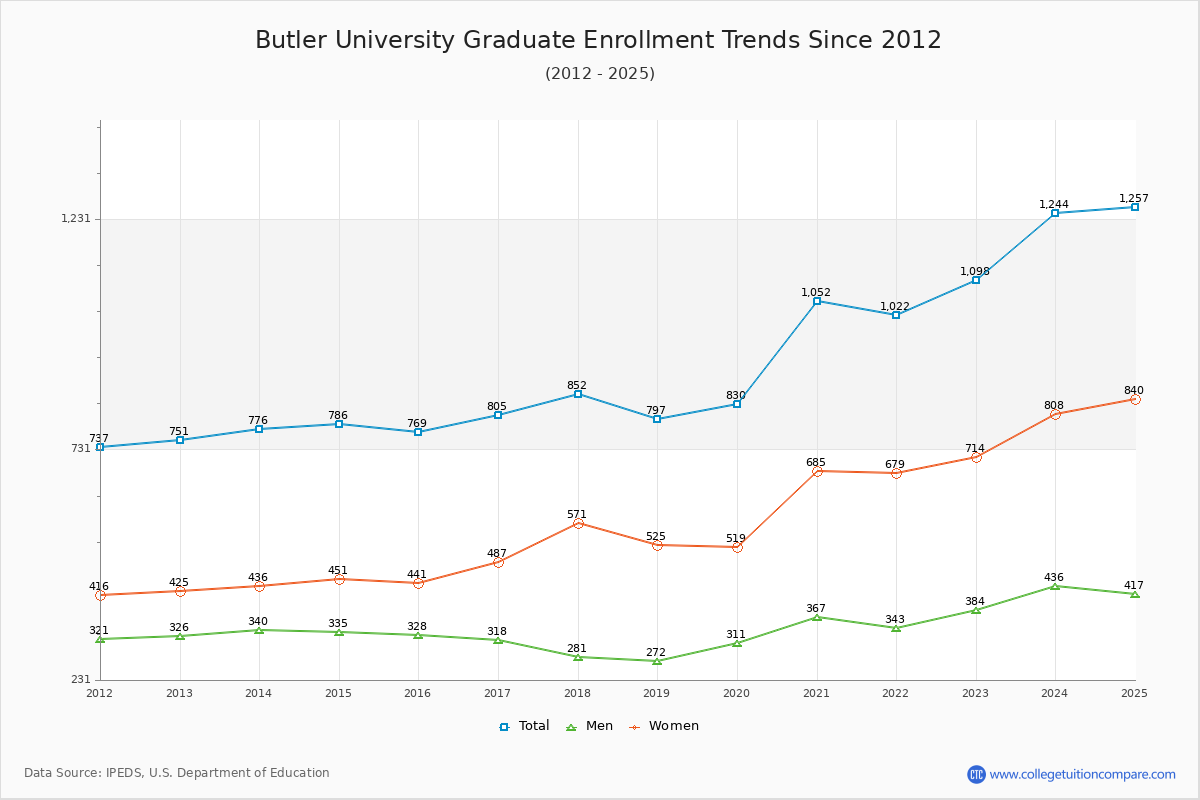
80.13% of total students is undergraduate students and 19.87% students is graduate students. The number of undergraduate students has increased by 466 and the graduate enrollment has increased by 347 over past 10 years.
The female to male ratio is 1.55 to 1 and it means that there are more female students enrolled in Butler than male students.
The following table and chart illustrate the changes in student population by gender at Butler University since 2012.
| Year | Total | Undergraduate | Graduate | ||||
|---|---|---|---|---|---|---|---|
| Total | Men | Women | Total | Men | Women | ||
| 2012-13 | 4,712 | 3,961 | 1,611 | 2,350 | 751 | 326 | 425 |
| 2013-14 | 4,827 115 | 4,051 90 | 1,599 -12 | 2,452 102 | 776 25 | 340 14 | 436 11 |
| 2014-15 | 4,848 21 | 4,062 11 | 1,636 37 | 2,426 -26 | 786 10 | 335 -5 | 451 15 |
| 2015-16 | 4,797 -51 | 4,028 -34 | 1,622 -14 | 2,406 -20 | 769 -17 | 328 -7 | 441 -10 |
| 2016-17 | 5,095 298 | 4,290 262 | 1,729 107 | 2,561 155 | 805 36 | 318 -10 | 487 46 |
| 2017-18 | 5,145 50 | 4,293 3 | 1,696 -33 | 2,597 36 | 852 47 | 281 -37 | 571 84 |
| 2018-19 | 5,495 350 | 4,698 405 | 1,894 198 | 2,804 207 | 797 -55 | 272 -9 | 525 -46 |
| 2019-20 | 5,515 20 | 4,685 -13 | 1,852 -42 | 2,833 29 | 830 33 | 311 39 | 519 -6 |
| 2020-21 | 5,544 29 | 4,492 -193 | 1,779 -73 | 2,713 -120 | 1,052 222 | 367 56 | 685 166 |
| 2021-22 | 5,559 15 | 4,537 45 | 1,815 36 | 2,722 9 | 1,022 -30 | 343 -24 | 679 -6 |
| 2022-23 | 5,525 -34 | 4,427 -110 | 1,785 -30 | 2,642 -80 | 1,098 76 | 384 41 | 714 35 |
| Average | 5,187 | 4,320 | 1,729 | 2,591 | 867 | 328 | 539 |