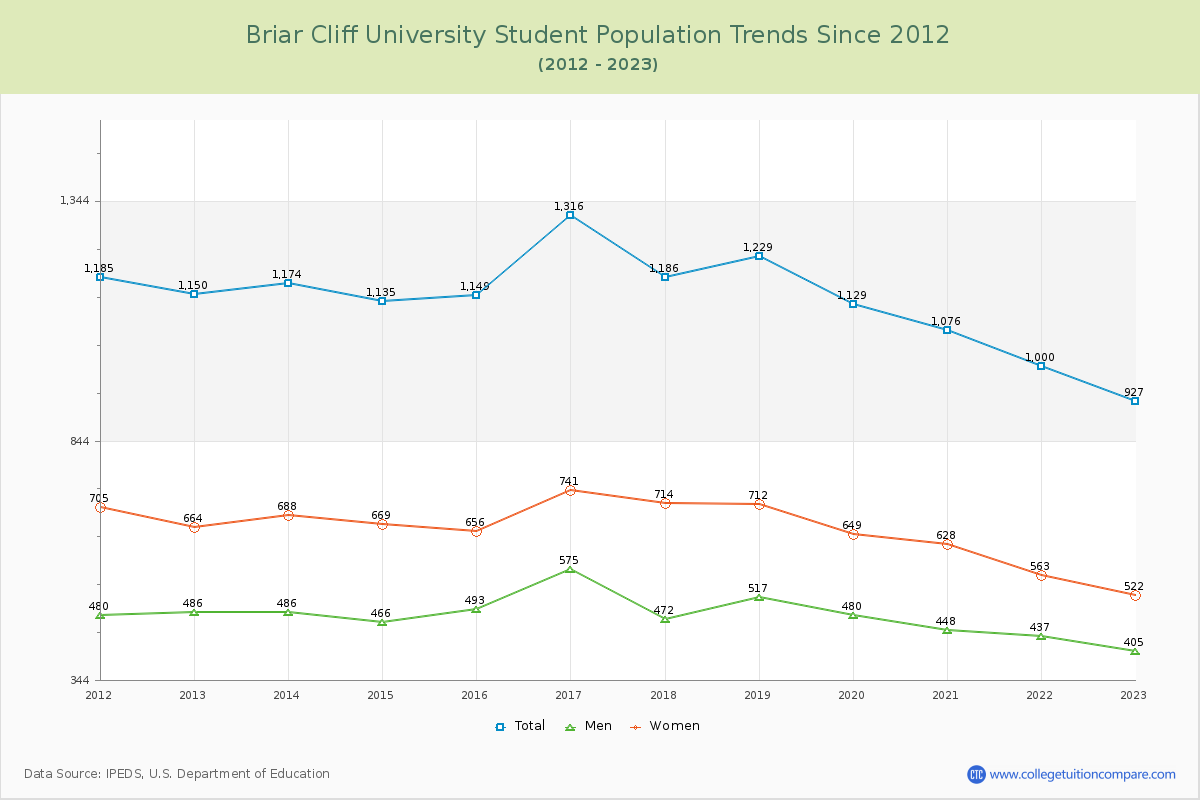
Student Population Changes
The average student population over the last 12 years is 1,134 where 927 students are attending the school for the academic year 2022-2023.
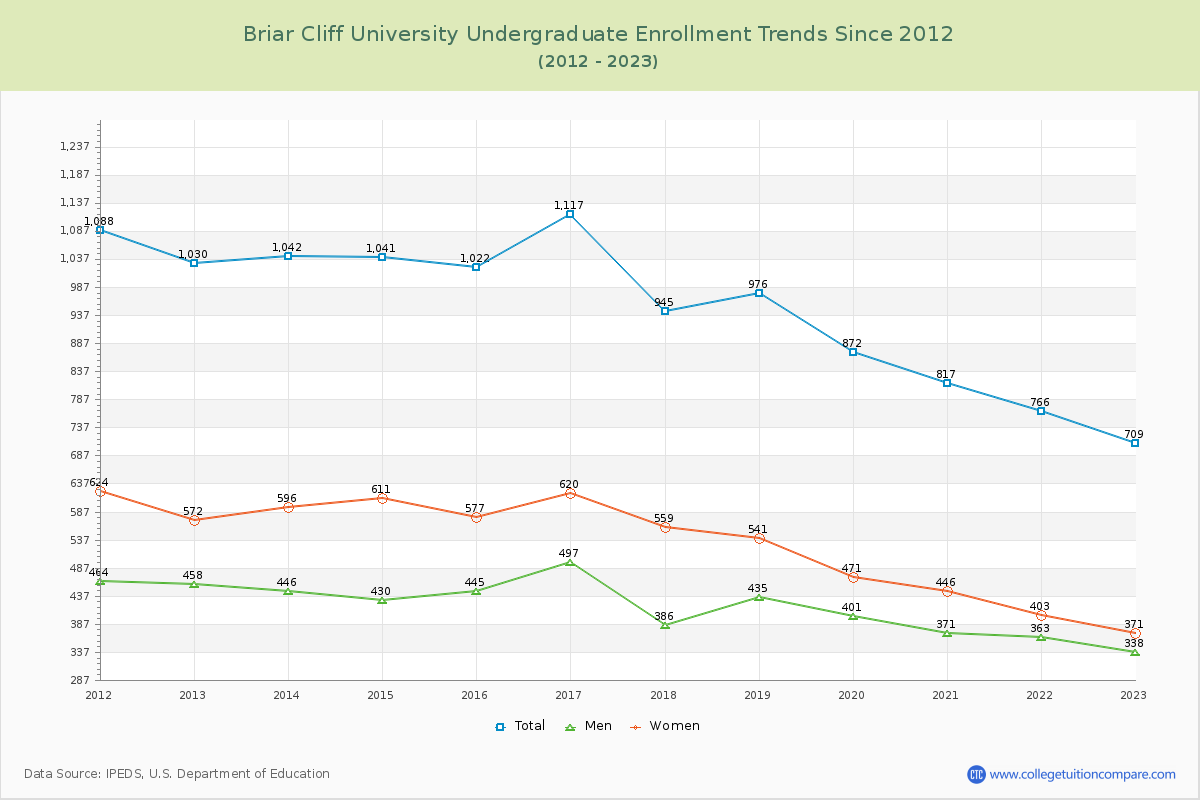
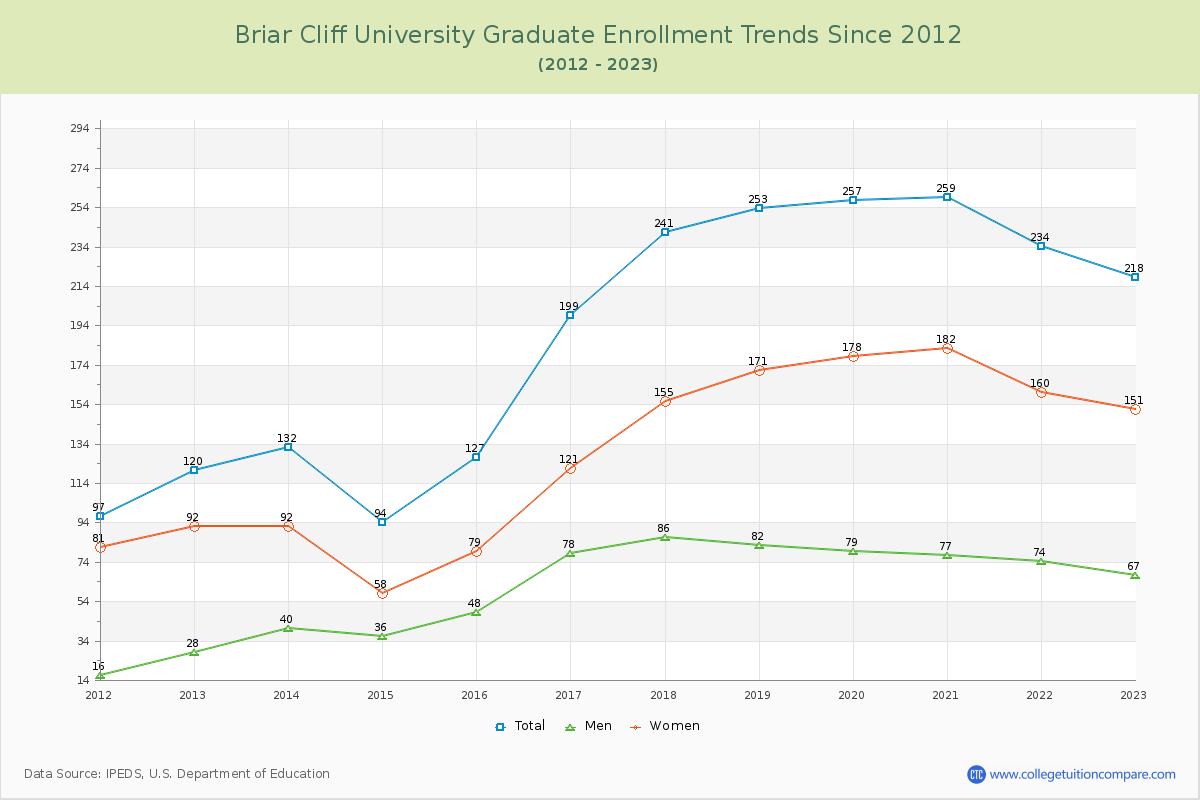
76.48% of total students is undergraduate students and 23.52% students is graduate students. The number of undergraduate students has decreased by 321 and the graduate enrollment has increased by 98 over past 10 years.
The female to male ratio is 1.29 to 1 and it means that there are slightly more female students enrolled in Briar Cliff than male students.
The following table and chart illustrate the changes in student population by gender at Briar Cliff University since 2012.
| Year | Total | Undergraduate | Graduate | ||||
|---|---|---|---|---|---|---|---|
| Total | Men | Women | Total | Men | Women | ||
| 2012-13 | 1,150 | 1,030 | 458 | 572 | 120 | 28 | 92 |
| 2013-14 | 1,174 24 | 1,042 12 | 446 -12 | 596 24 | 132 12 | 40 12 | 92 0 |
| 2014-15 | 1,135 -39 | 1,041 -1 | 430 -16 | 611 15 | 94 -38 | 36 -4 | 58 -34 |
| 2015-16 | 1,149 14 | 1,022 -19 | 445 15 | 577 -34 | 127 33 | 48 12 | 79 21 |
| 2016-17 | 1,316 167 | 1,117 95 | 497 52 | 620 43 | 199 72 | 78 30 | 121 42 |
| 2017-18 | 1,186 -130 | 945 -172 | 386 -111 | 559 -61 | 241 42 | 86 8 | 155 34 |
| 2018-19 | 1,229 43 | 976 31 | 435 49 | 541 -18 | 253 12 | 82 -4 | 171 16 |
| 2019-20 | 1,129 -100 | 872 -104 | 401 -34 | 471 -70 | 257 4 | 79 -3 | 178 7 |
| 2020-21 | 1,076 -53 | 817 -55 | 371 -30 | 446 -25 | 259 2 | 77 -2 | 182 4 |
| 2021-22 | 1,000 -76 | 766 -51 | 363 -8 | 403 -43 | 234 -25 | 74 -3 | 160 -22 |
| 2022-23 | 927 -73 | 709 -57 | 338 -25 | 371 -32 | 218 -16 | 67 -7 | 151 -9 |
| Average | 1,134 | 940 | 415 | 524 | 194 | 63 | 131 |