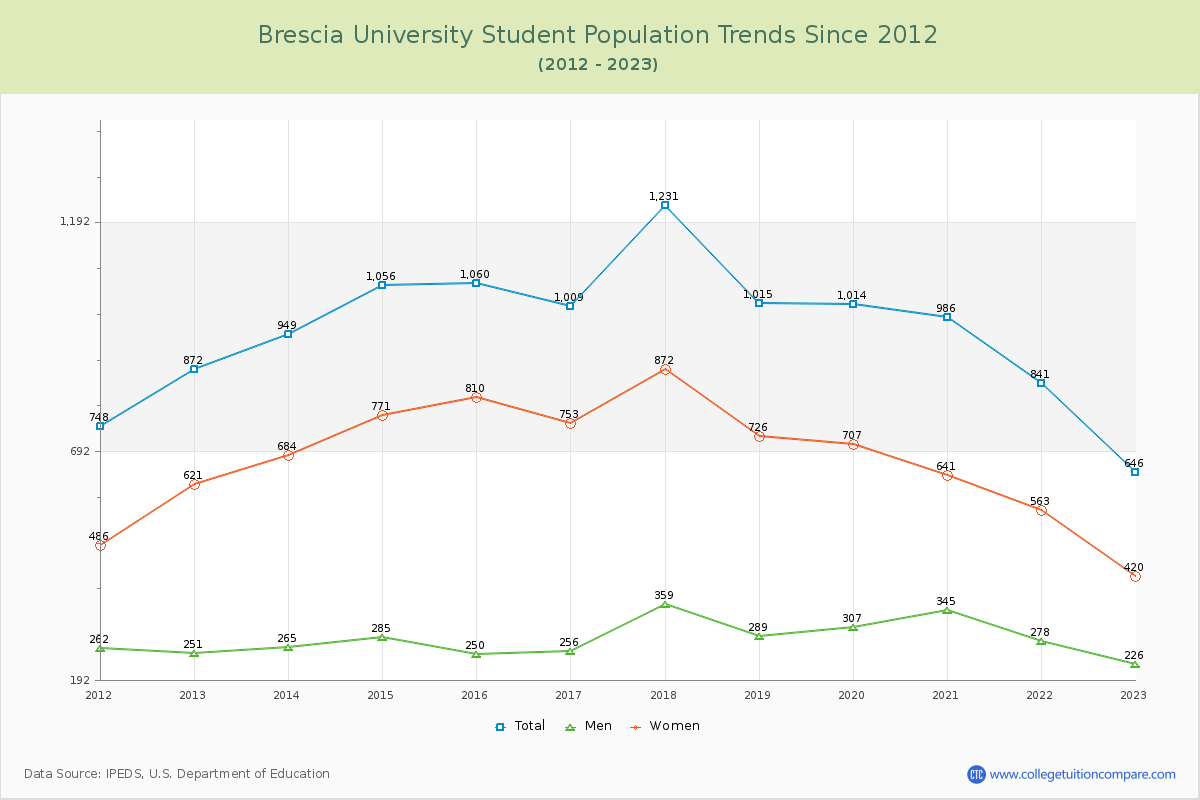
Student Population Changes
The average student population over the last 12 years is 971 where 646 students are attending the school for the academic year 2022-2023.
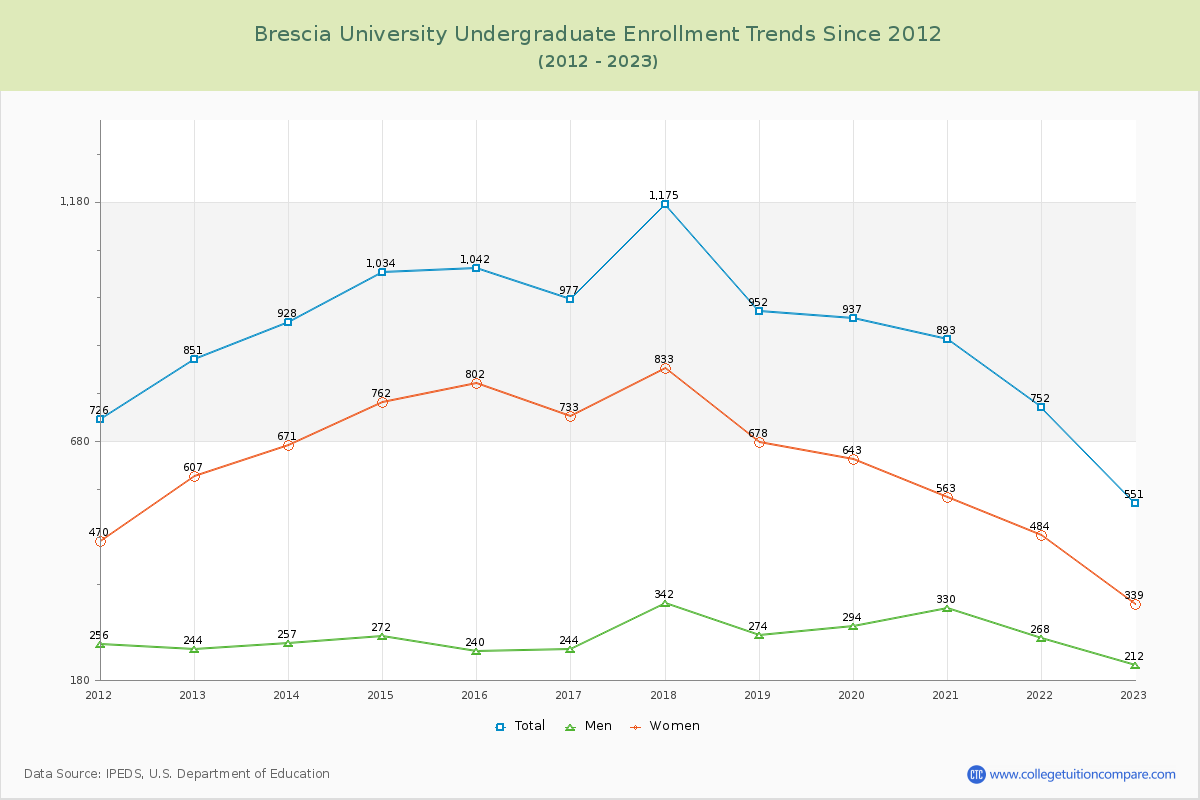
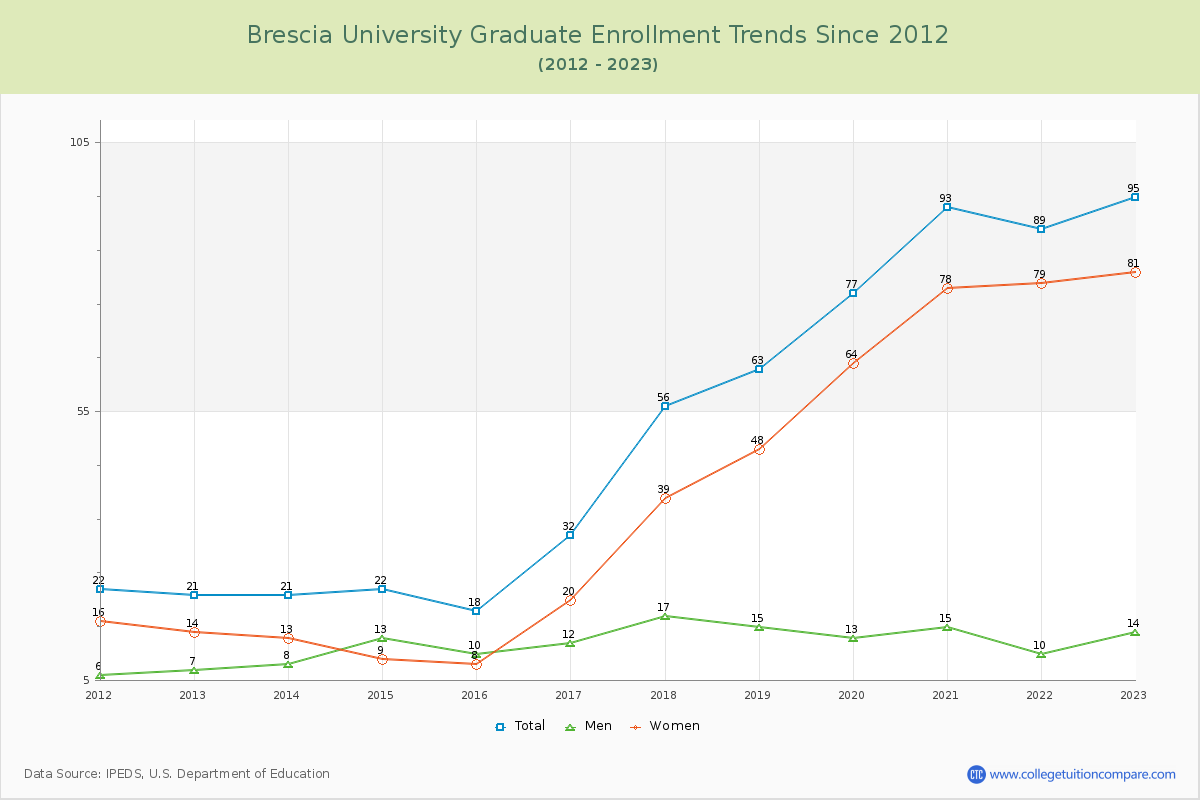
85.29% of total students is undergraduate students and 14.71% students is graduate students. The number of undergraduate students has decreased by 300 and the graduate enrollment has increased by 74 over past 10 years.
The female to male ratio is 1.86 to 1 and it means that there are more female students enrolled in Brescia than male students.
The following table and chart illustrate the changes in student population by gender at Brescia University since 2012.
| Year | Total | Undergraduate | Graduate | ||||
|---|---|---|---|---|---|---|---|
| Total | Men | Women | Total | Men | Women | ||
| 2012-13 | 872 | 851 | 244 | 607 | 21 | 7 | 14 |
| 2013-14 | 949 77 | 928 77 | 257 13 | 671 64 | 21 0 | 8 1 | 13 -1 |
| 2014-15 | 1,056 107 | 1,034 106 | 272 15 | 762 91 | 22 1 | 13 5 | 9 -4 |
| 2015-16 | 1,060 4 | 1,042 8 | 240 -32 | 802 40 | 18 -4 | 10 -3 | 8 -1 |
| 2016-17 | 1,009 -51 | 977 -65 | 244 4 | 733 -69 | 32 14 | 12 2 | 20 12 |
| 2017-18 | 1,231 222 | 1,175 198 | 342 98 | 833 100 | 56 24 | 17 5 | 39 19 |
| 2018-19 | 1,015 -216 | 952 -223 | 274 -68 | 678 -155 | 63 7 | 15 -2 | 48 9 |
| 2019-20 | 1,014 -1 | 937 -15 | 294 20 | 643 -35 | 77 14 | 13 -2 | 64 16 |
| 2020-21 | 986 -28 | 893 -44 | 330 36 | 563 -80 | 93 16 | 15 2 | 78 14 |
| 2021-22 | 841 -145 | 752 -141 | 268 -62 | 484 -79 | 89 -4 | 10 -5 | 79 1 |
| 2022-23 | 646 -195 | 551 -201 | 212 -56 | 339 -145 | 95 6 | 14 4 | 81 2 |
| Average | 971 | 917 | 271 | 647 | 53 | 12 | 41 |