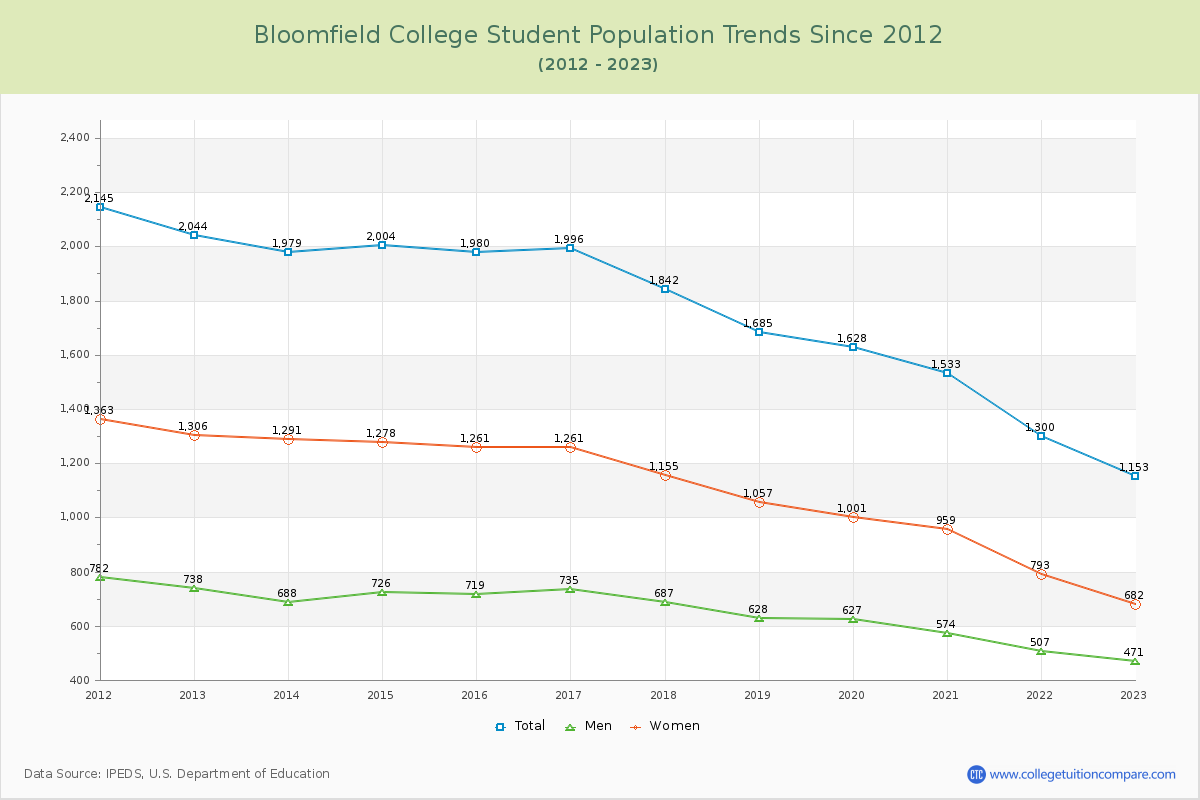
Student Population Changes
The average student population over the last 12 years is 1,740 where 1,153 students are attending the school for the academic year 2022-2023.
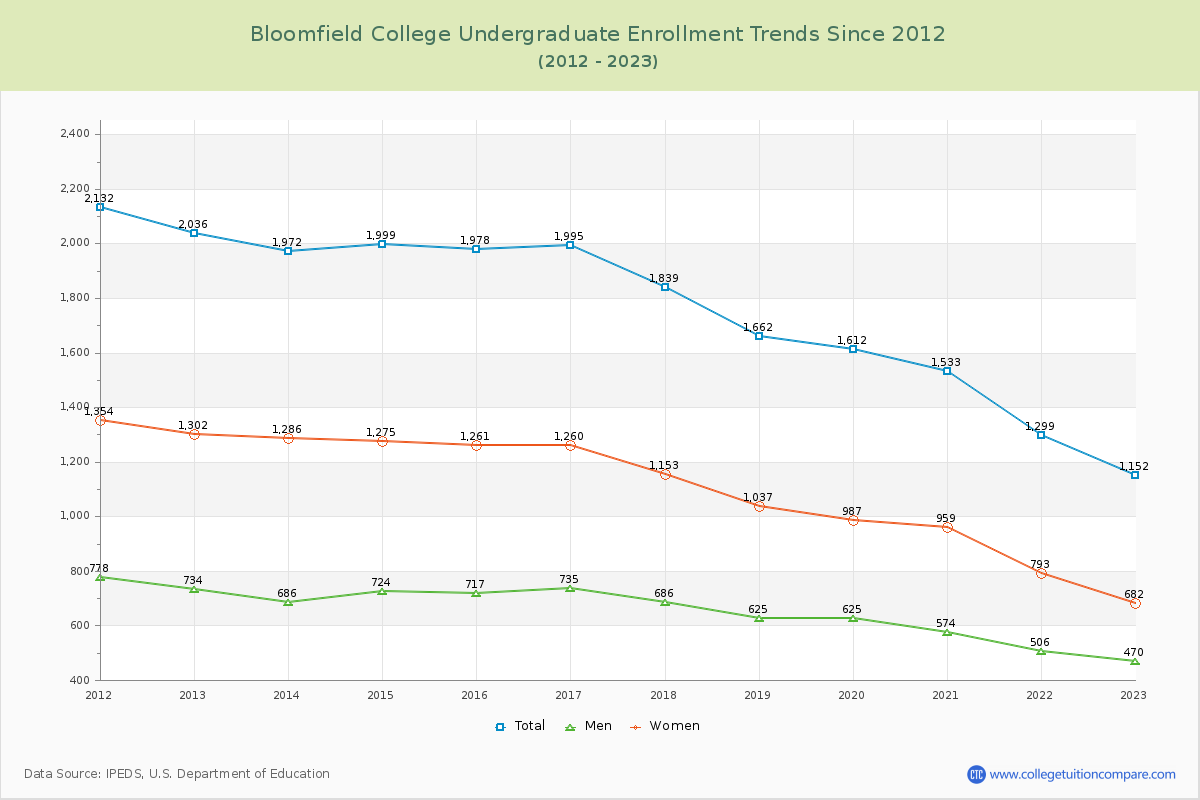
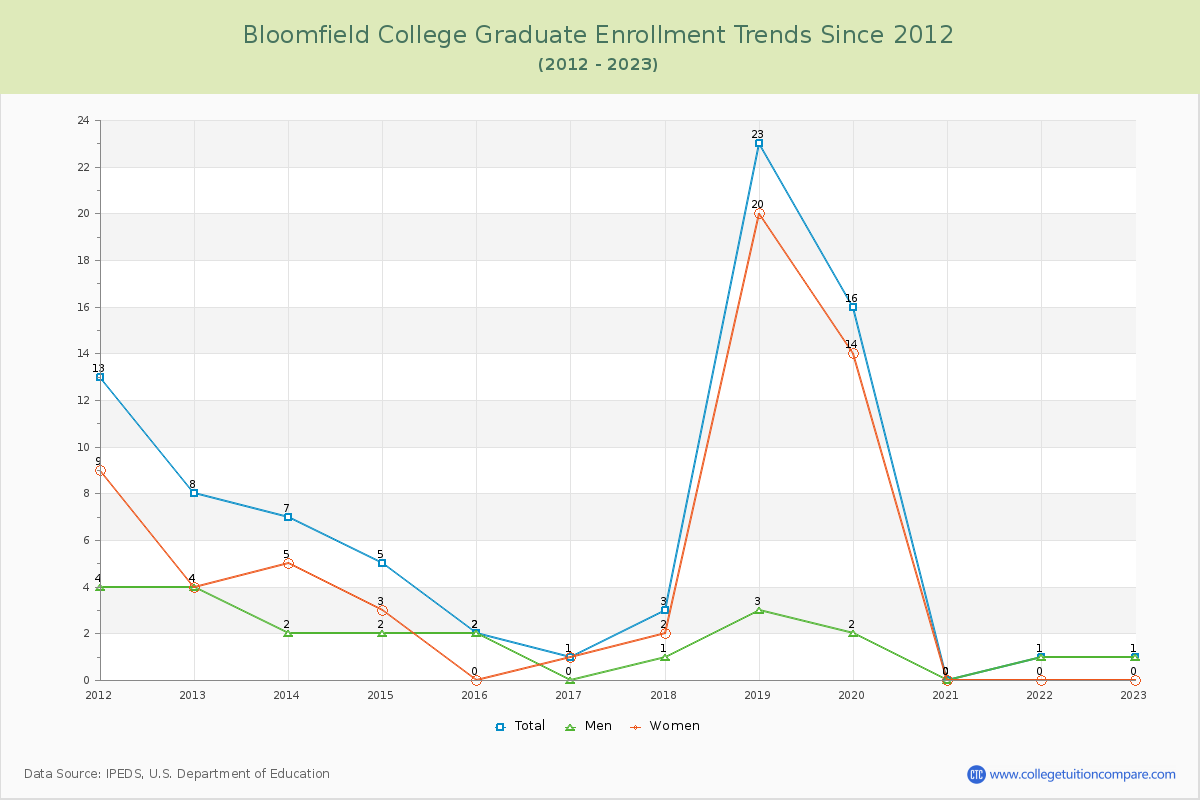
99.91% of total students is undergraduate students and 0.09% students is graduate students. The number of undergraduate students has decreased by 884 and the graduate enrollment has decreased by 7 over past 10 years.
The female to male ratio is 1.45 to 1 and it means that there are more female students enrolled in Bloomfield than male students.
The following table and chart illustrate the changes in student population by gender at Bloomfield College since 2012.
| Year | Total | Undergraduate | Graduate | ||||
|---|---|---|---|---|---|---|---|
| Total | Men | Women | Total | Men | Women | ||
| 2012-13 | 2,044 | 2,036 | 734 | 1,302 | 8 | 4 | 4 |
| 2013-14 | 1,979 -65 | 1,972 -64 | 686 -48 | 1,286 -16 | 7 -1 | 2 -2 | 5 1 |
| 2014-15 | 2,004 25 | 1,999 27 | 724 38 | 1,275 -11 | 5 -2 | 2 0 | 3 -2 |
| 2015-16 | 1,980 -24 | 1,978 -21 | 717 -7 | 1,261 -14 | 2 -3 | 2 0 | 0 -3 |
| 2016-17 | 1,996 16 | 1,995 17 | 735 18 | 1,260 -1 | 1 -1 | 0 -2 | 1 1 |
| 2017-18 | 1,842 -154 | 1,839 -156 | 686 -49 | 1,153 -107 | 3 2 | 1 1 | 2 1 |
| 2018-19 | 1,685 -157 | 1,662 -177 | 625 -61 | 1,037 -116 | 23 20 | 3 2 | 20 18 |
| 2019-20 | 1,628 -57 | 1,612 -50 | 625 0 | 987 -50 | 16 -7 | 2 -1 | 14 -6 |
| 2020-21 | 1,533 -95 | 1,533 -79 | 574 -51 | 959 -28 | 0 -16 | 0 -2 | 0 -14 |
| 2021-22 | 1,300 -233 | 1,299 -234 | 506 -68 | 793 -166 | 1 1 | 1 1 | 0 0 |
| 2022-23 | 1,153 -147 | 1,152 -147 | 470 -36 | 682 -111 | 1 0 | 1 0 | 0 0 |
| Average | 1,740 | 1,734 | 644 | 1,090 | 6 | 2 | 4 |