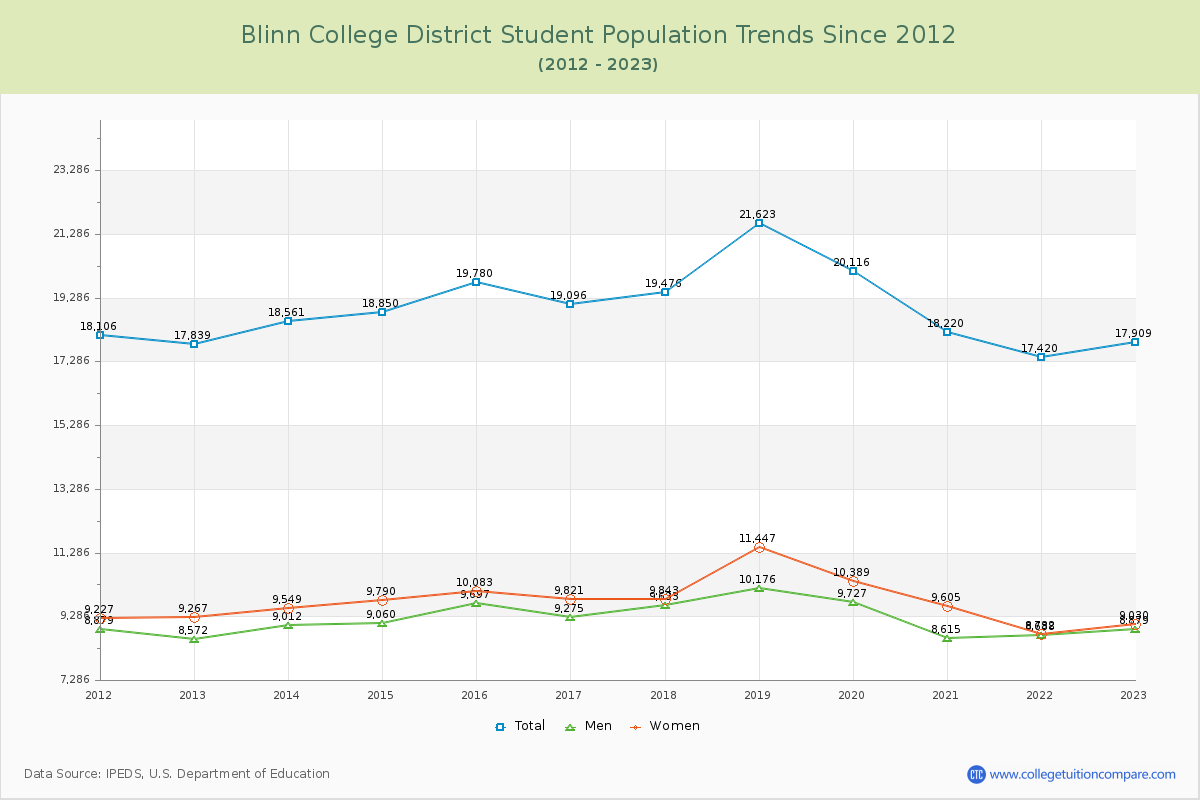
Student Population Changes
The average student population over the last 12 years is 18,990 where 17,909 students are attending the school for the academic year 2022-2023.
The female to male ratio is 1.02 to 1 and it means that there are similar numbers of female and male students enrolled in Blinn College District.
The following table and chart illustrate the changes in student population by gender at Blinn College District since 2012.
| Year | Total | Men | Women |
|---|---|---|---|
| 2012-13 | 17,839 | 8,572 | 9,267 |
| 2013-14 | 18,561 722 | 9,012 440 | 9,549 282 |
| 2014-15 | 18,850 289 | 9,060 48 | 9,790 241 |
| 2015-16 | 19,780 930 | 9,697 637 | 10,083 293 |
| 2016-17 | 19,096 -684 | 9,275 -422 | 9,821 -262 |
| 2017-18 | 19,476 380 | 9,633 358 | 9,843 22 |
| 2018-19 | 21,623 2,147 | 10,176 543 | 11,447 1,604 |
| 2019-20 | 20,116 -1,507 | 9,727 -449 | 10,389 -1,058 |
| 2020-21 | 18,220 -1,896 | 8,615 -1,112 | 9,605 -784 |
| 2021-22 | 17,420 -800 | 8,688 73 | 8,732 -873 |
| 2022-23 | 17,909 489 | 8,879 191 | 9,030 298 |
| Average | 18,990 | 9,212 | 9,778 |