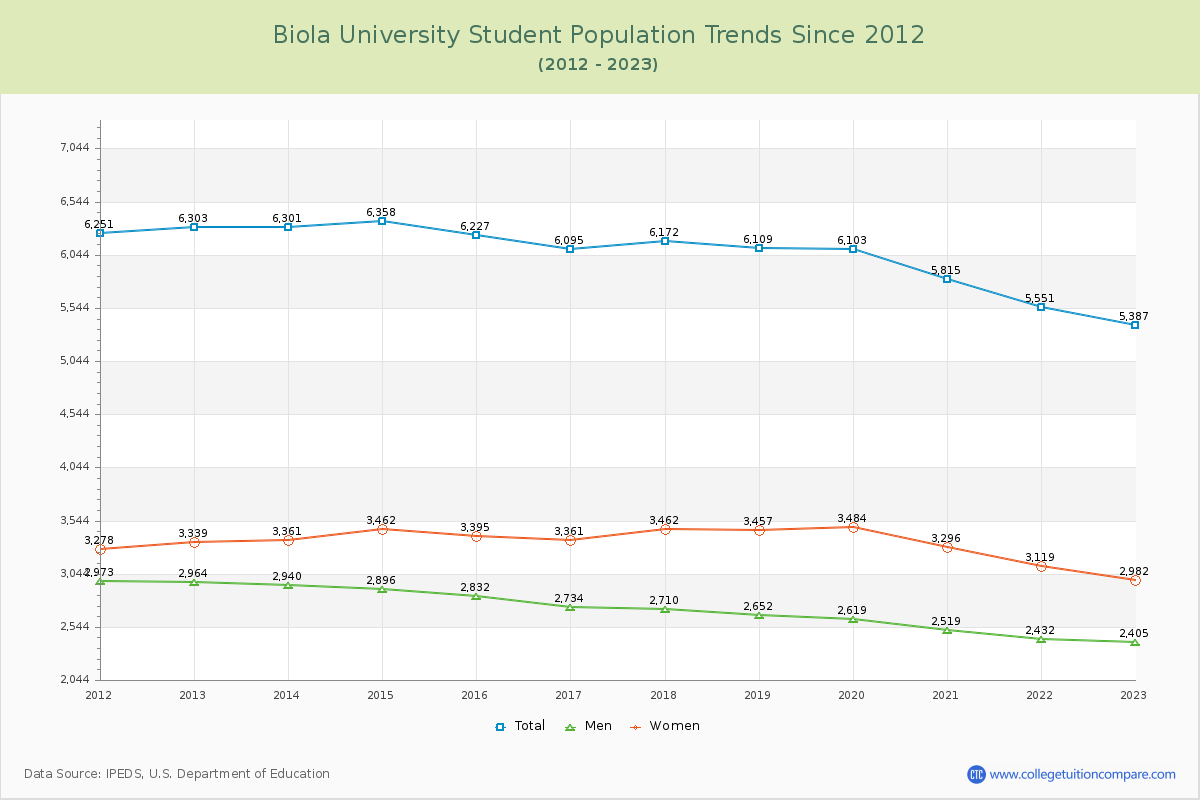
Student Population Changes
The average student population over the last 12 years is 6,038 where 5,387 students are attending the school for the academic year 2022-2023.
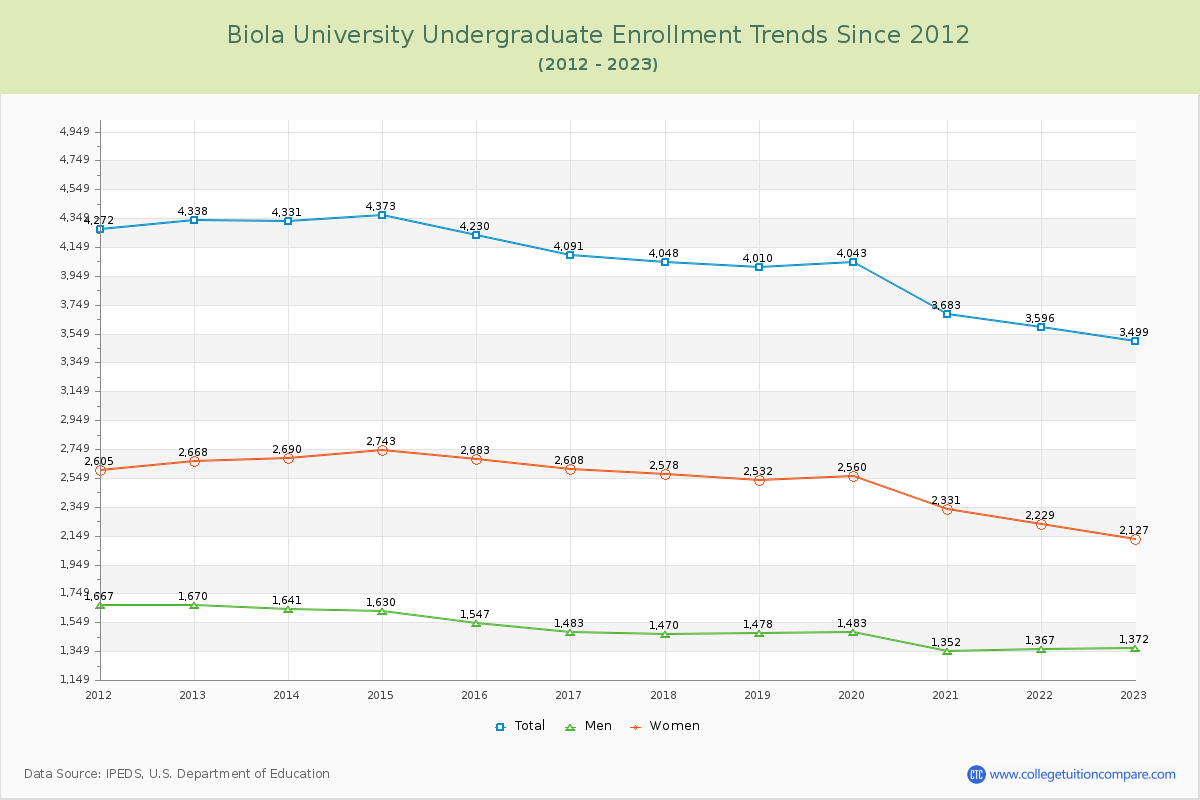
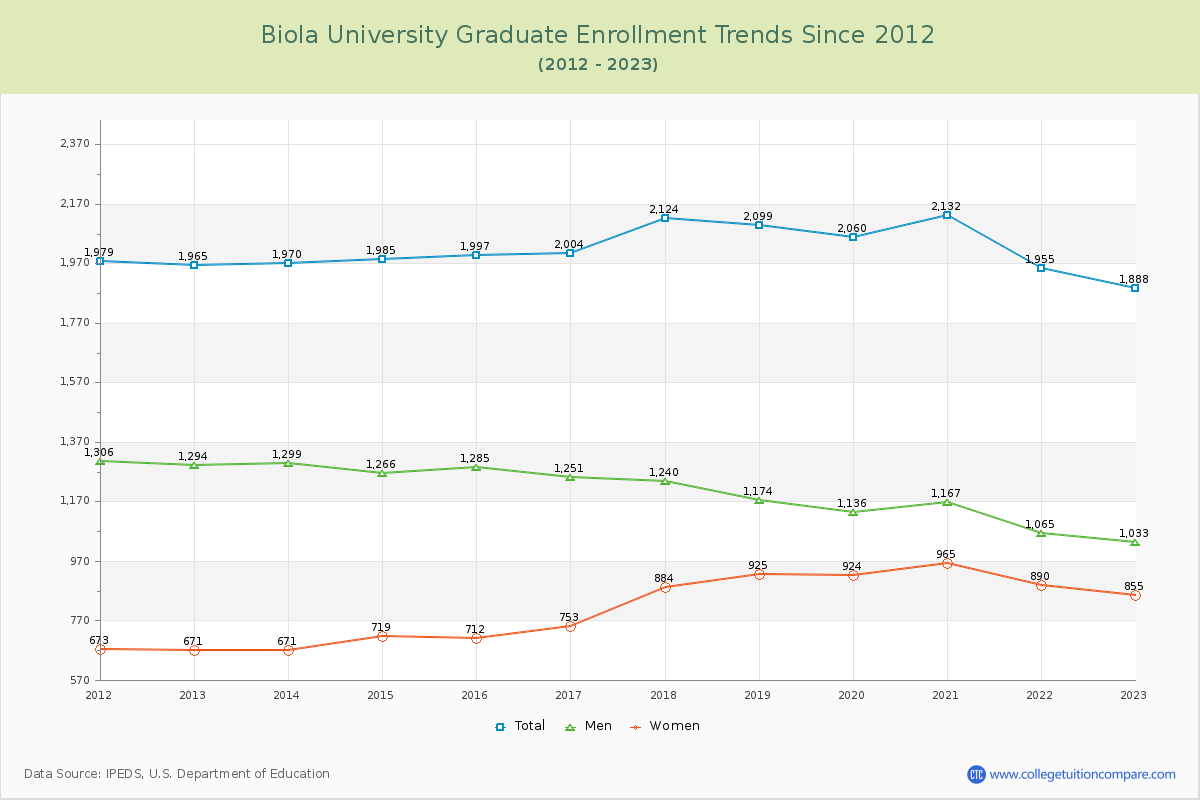
64.95% of total students is undergraduate students and 35.05% students is graduate students. The number of undergraduate students has decreased by 839 and the graduate enrollment has decreased by 77 over past 10 years.
The female to male ratio is 1.24 to 1 and it means that there are slightly more female students enrolled in Biola than male students.
The following table and chart illustrate the changes in student population by gender at Biola University since 2012.
| Year | Total | Undergraduate | Graduate | ||||
|---|---|---|---|---|---|---|---|
| Total | Men | Women | Total | Men | Women | ||
| 2012-13 | 6,303 | 4,338 | 1,670 | 2,668 | 1,965 | 1,294 | 671 |
| 2013-14 | 6,301 -2 | 4,331 -7 | 1,641 -29 | 2,690 22 | 1,970 5 | 1,299 5 | 671 0 |
| 2014-15 | 6,358 57 | 4,373 42 | 1,630 -11 | 2,743 53 | 1,985 15 | 1,266 -33 | 719 48 |
| 2015-16 | 6,227 -131 | 4,230 -143 | 1,547 -83 | 2,683 -60 | 1,997 12 | 1,285 19 | 712 -7 |
| 2016-17 | 6,095 -132 | 4,091 -139 | 1,483 -64 | 2,608 -75 | 2,004 7 | 1,251 -34 | 753 41 |
| 2017-18 | 6,172 77 | 4,048 -43 | 1,470 -13 | 2,578 -30 | 2,124 120 | 1,240 -11 | 884 131 |
| 2018-19 | 6,109 -63 | 4,010 -38 | 1,478 8 | 2,532 -46 | 2,099 -25 | 1,174 -66 | 925 41 |
| 2019-20 | 6,103 -6 | 4,043 33 | 1,483 5 | 2,560 28 | 2,060 -39 | 1,136 -38 | 924 -1 |
| 2020-21 | 5,815 -288 | 3,683 -360 | 1,352 -131 | 2,331 -229 | 2,132 72 | 1,167 31 | 965 41 |
| 2021-22 | 5,551 -264 | 3,596 -87 | 1,367 15 | 2,229 -102 | 1,955 -177 | 1,065 -102 | 890 -75 |
| 2022-23 | 5,387 -164 | 3,499 -97 | 1,372 5 | 2,127 -102 | 1,888 -67 | 1,033 -32 | 855 -35 |
| Average | 6,038 | 4,022 | 1,499 | 2,523 | 2,016 | 1,201 | 815 |