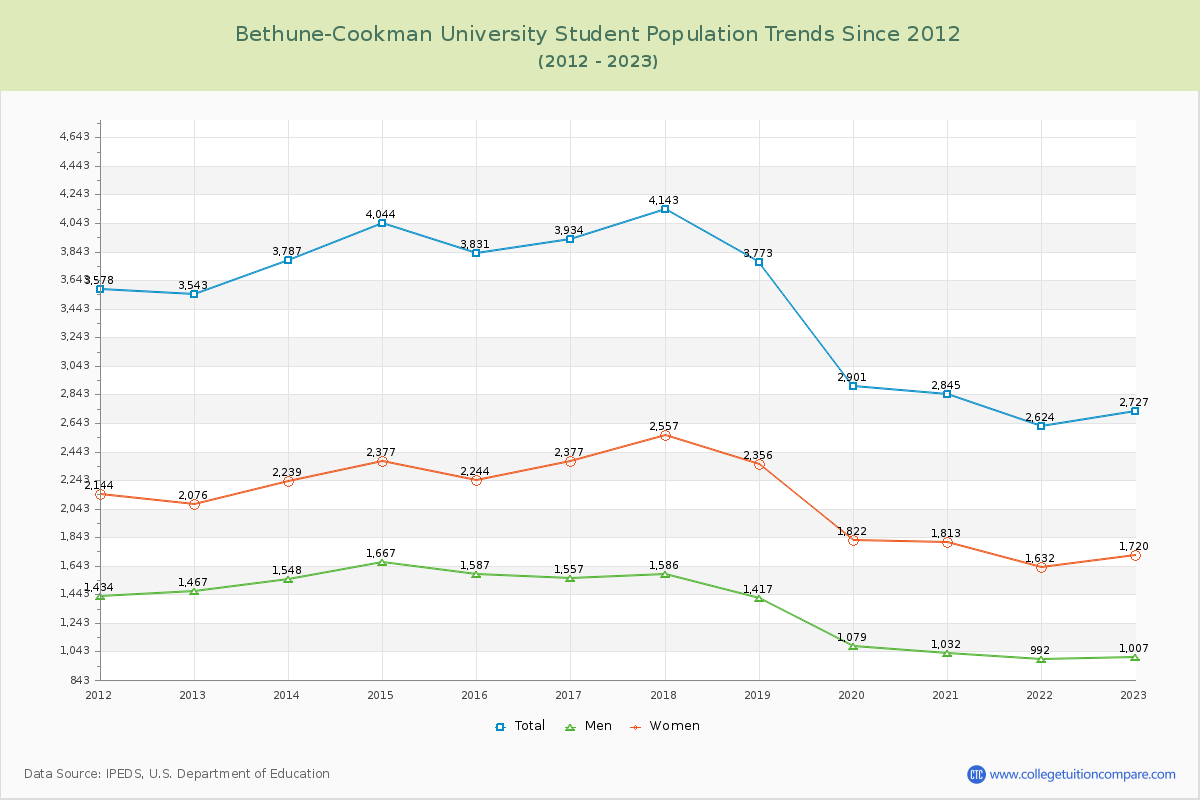
Student Population Changes
The average student population over the last 12 years is 3,468 where 2,727 students are attending the school for the academic year 2022-2023.
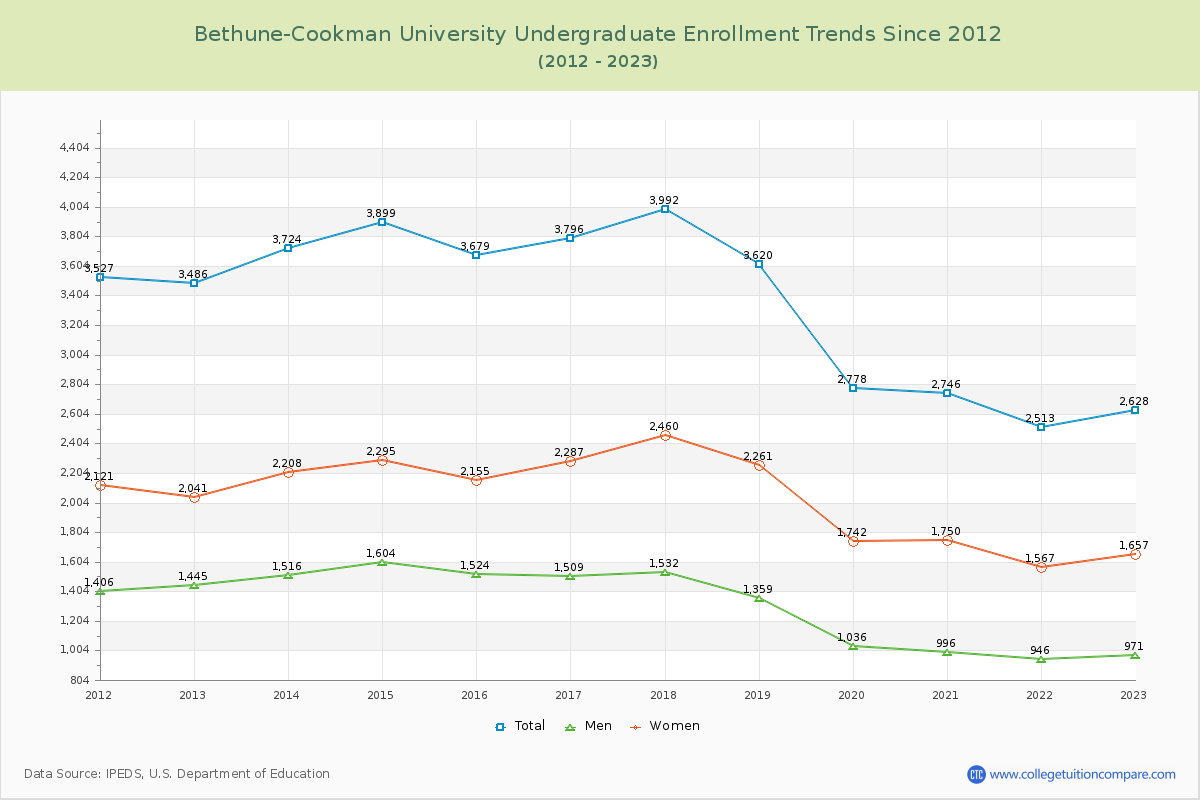
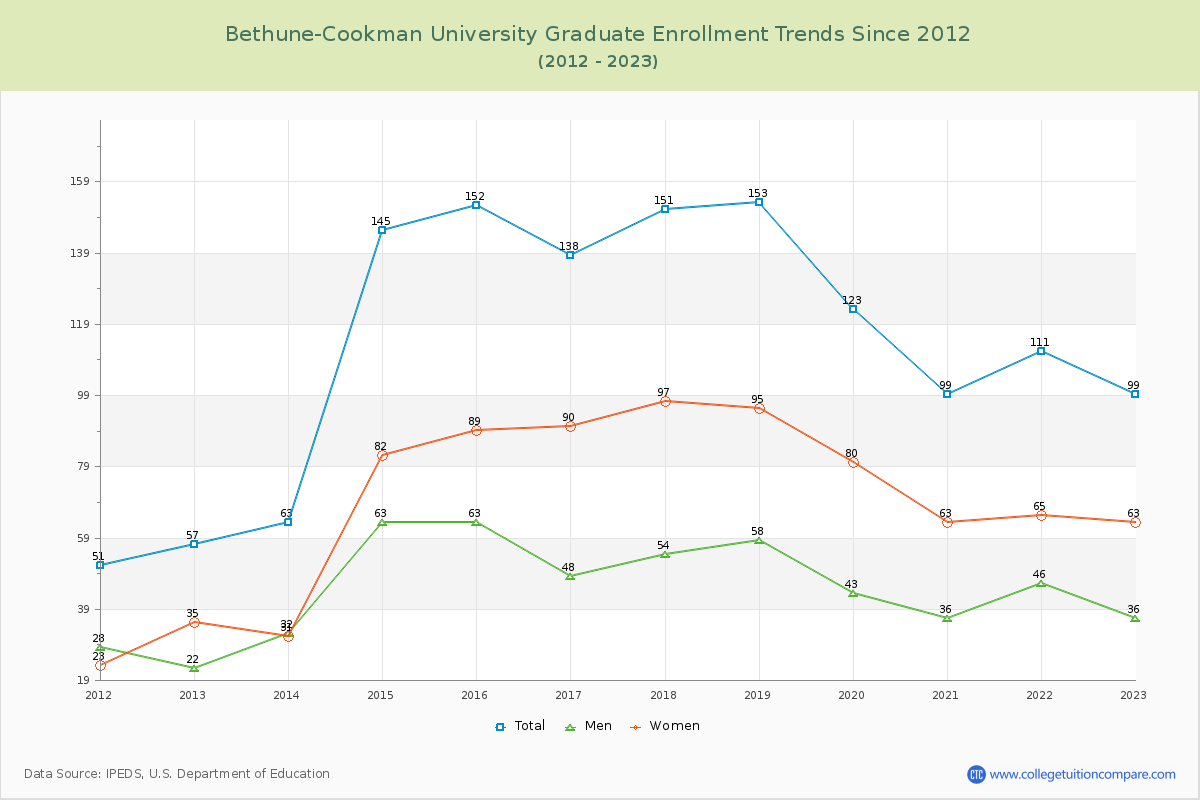
96.37% of total students is undergraduate students and 3.63% students is graduate students. The number of undergraduate students has decreased by 858 and the graduate enrollment has increased by 42 over past 10 years.
The female to male ratio is 1.71 to 1 and it means that there are more female students enrolled in B CU than male students.
The following table and chart illustrate the changes in student population by gender at Bethune-Cookman University since 2012.
| Year | Total | Undergraduate | Graduate | ||||
|---|---|---|---|---|---|---|---|
| Total | Men | Women | Total | Men | Women | ||
| 2012-13 | 3,543 | 3,486 | 1,445 | 2,041 | 57 | 22 | 35 |
| 2013-14 | 3,787 244 | 3,724 238 | 1,516 71 | 2,208 167 | 63 6 | 32 10 | 31 -4 |
| 2014-15 | 4,044 257 | 3,899 175 | 1,604 88 | 2,295 87 | 145 82 | 63 31 | 82 51 |
| 2015-16 | 3,831 -213 | 3,679 -220 | 1,524 -80 | 2,155 -140 | 152 7 | 63 0 | 89 7 |
| 2016-17 | 3,934 103 | 3,796 117 | 1,509 -15 | 2,287 132 | 138 -14 | 48 -15 | 90 1 |
| 2017-18 | 4,143 209 | 3,992 196 | 1,532 23 | 2,460 173 | 151 13 | 54 6 | 97 7 |
| 2018-19 | 3,773 -370 | 3,620 -372 | 1,359 -173 | 2,261 -199 | 153 2 | 58 4 | 95 -2 |
| 2019-20 | 2,901 -872 | 2,778 -842 | 1,036 -323 | 1,742 -519 | 123 -30 | 43 -15 | 80 -15 |
| 2020-21 | 2,845 -56 | 2,746 -32 | 996 -40 | 1,750 8 | 99 -24 | 36 -7 | 63 -17 |
| 2021-22 | 2,624 -221 | 2,513 -233 | 946 -50 | 1,567 -183 | 111 12 | 46 10 | 65 2 |
| 2022-23 | 2,727 103 | 2,628 115 | 971 25 | 1,657 90 | 99 -12 | 36 -10 | 63 -2 |
| Average | 3,468 | 3,351 | 1,313 | 2,038 | 117 | 46 | 72 |