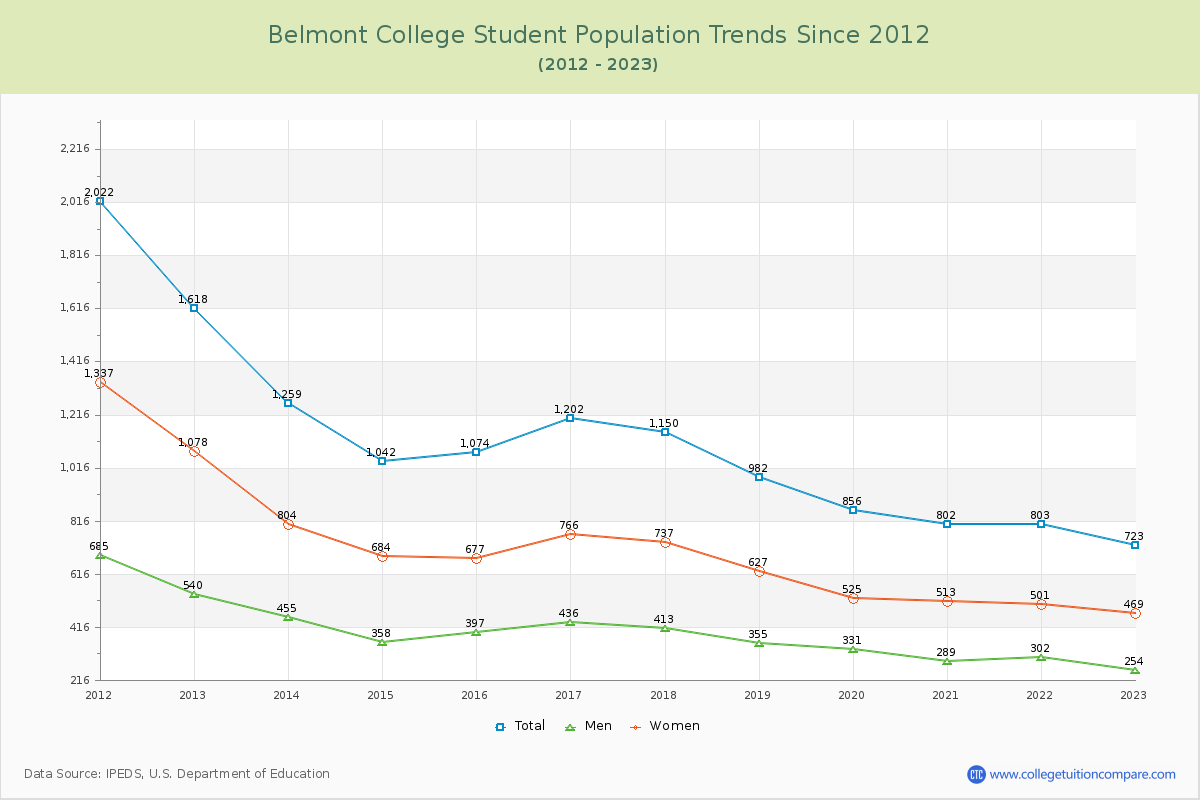
Student Population Changes
The average student population over the last 12 years is 1,046 where 723 students are attending the school for the academic year 2022-2023.
The female to male ratio is 1.85 to 1 and it means that there are more female students enrolled in Belmont than male students.
The following table and chart illustrate the changes in student population by gender at Belmont College since 2012.
| Year | Total | Men | Women |
|---|---|---|---|
| 2012-13 | 1,618 | 540 | 1,078 |
| 2013-14 | 1,259 -359 | 455 -85 | 804 -274 |
| 2014-15 | 1,042 -217 | 358 -97 | 684 -120 |
| 2015-16 | 1,074 32 | 397 39 | 677 -7 |
| 2016-17 | 1,202 128 | 436 39 | 766 89 |
| 2017-18 | 1,150 -52 | 413 -23 | 737 -29 |
| 2018-19 | 982 -168 | 355 -58 | 627 -110 |
| 2019-20 | 856 -126 | 331 -24 | 525 -102 |
| 2020-21 | 802 -54 | 289 -42 | 513 -12 |
| 2021-22 | 803 1 | 302 13 | 501 -12 |
| 2022-23 | 723 -80 | 254 -48 | 469 -32 |
| Average | 1,046 | 375 | 671 |