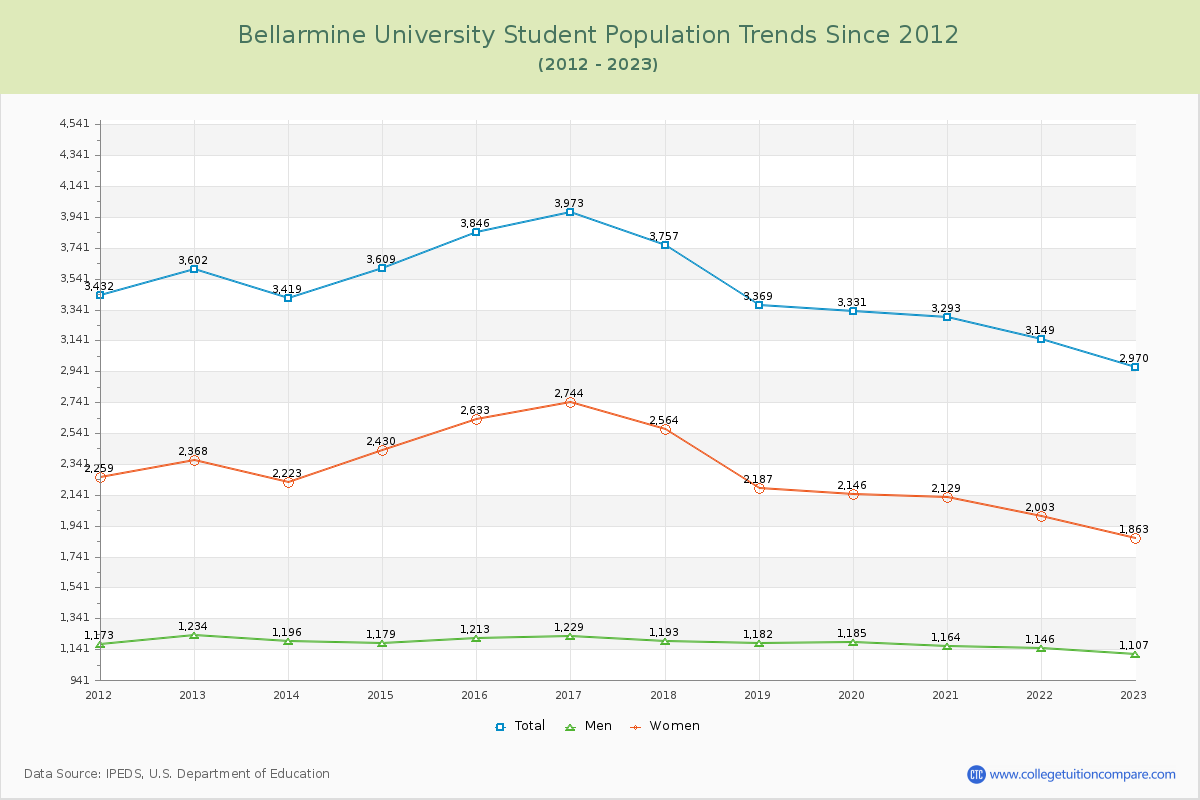
Student Population Changes
The average student population over the last 12 years is 3,483 where 2,970 students are attending the school for the academic year 2022-2023.
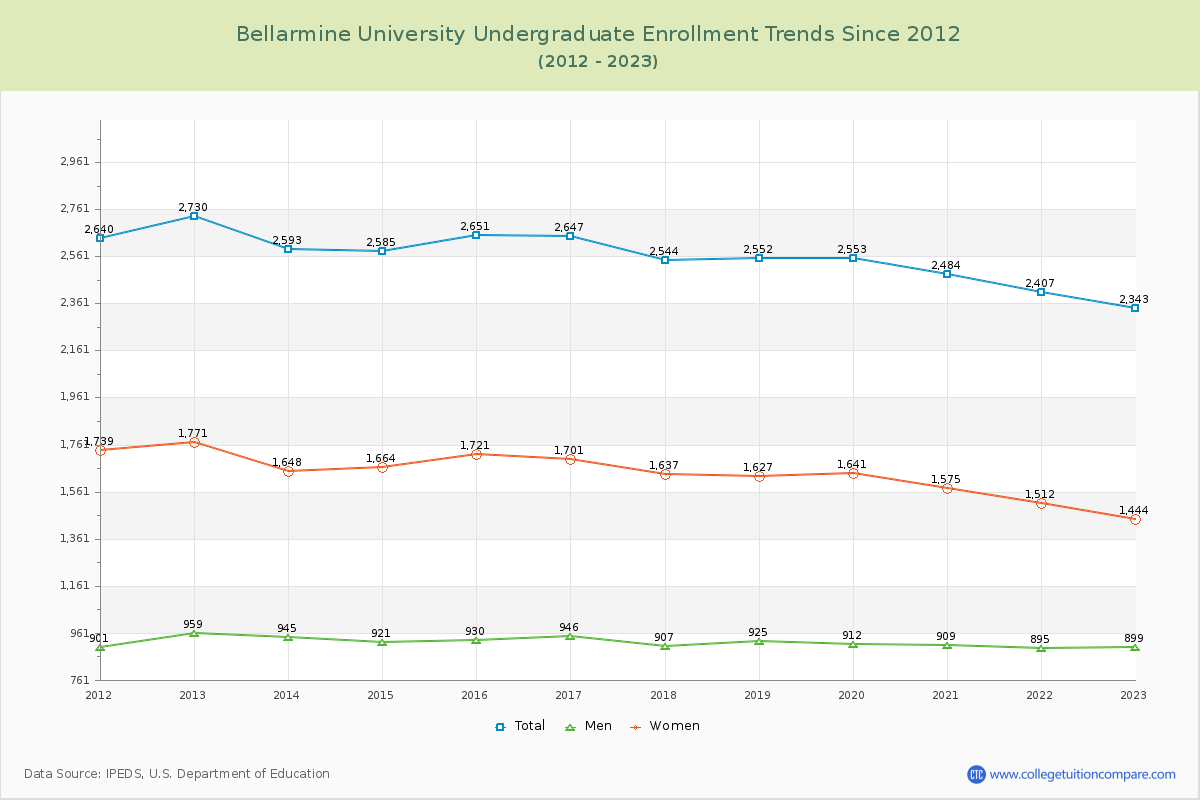
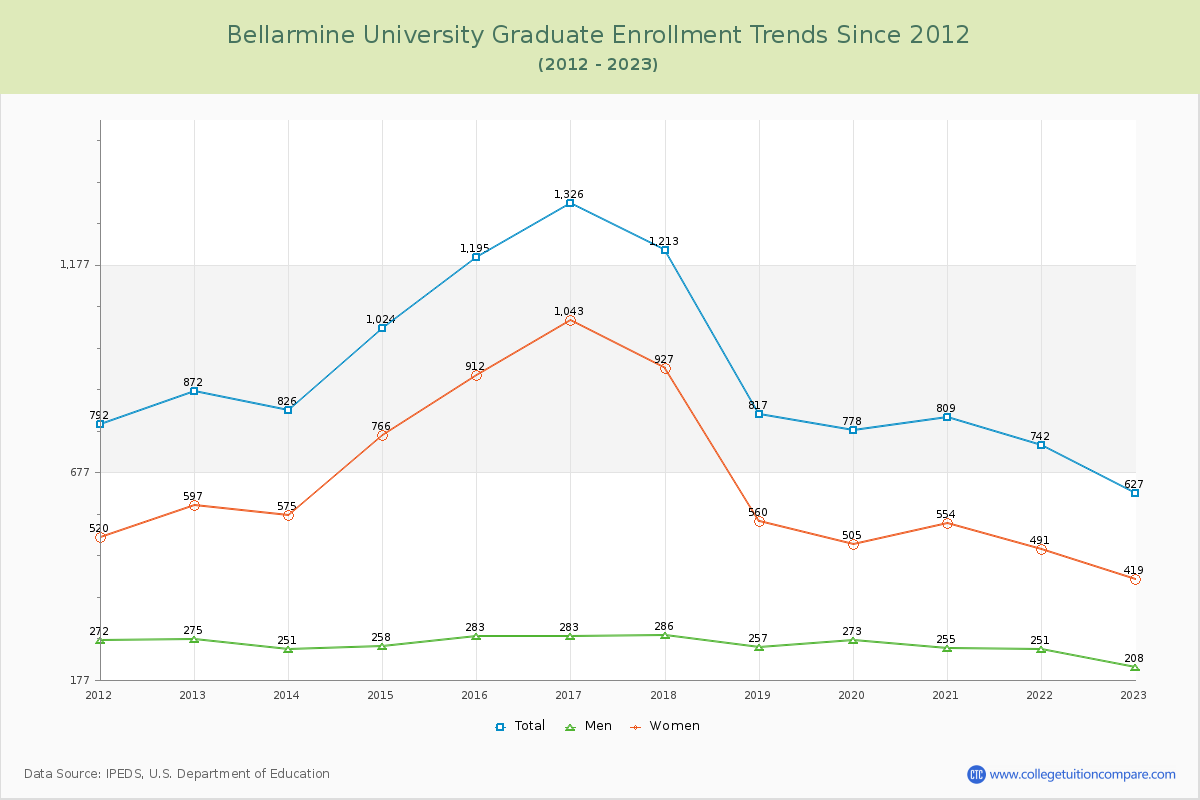
78.89% of total students is undergraduate students and 21.11% students is graduate students. The number of undergraduate students has decreased by 387 and the graduate enrollment has decreased by 245 over past 10 years.
The female to male ratio is 1.68 to 1 and it means that there are more female students enrolled in Bellarmine than male students.
The following table and chart illustrate the changes in student population by gender at Bellarmine University since 2012.
| Year | Total | Undergraduate | Graduate | ||||
|---|---|---|---|---|---|---|---|
| Total | Men | Women | Total | Men | Women | ||
| 2012-13 | 3,602 | 2,730 | 959 | 1,771 | 872 | 275 | 597 |
| 2013-14 | 3,419 -183 | 2,593 -137 | 945 -14 | 1,648 -123 | 826 -46 | 251 -24 | 575 -22 |
| 2014-15 | 3,609 190 | 2,585 -8 | 921 -24 | 1,664 16 | 1,024 198 | 258 7 | 766 191 |
| 2015-16 | 3,846 237 | 2,651 66 | 930 9 | 1,721 57 | 1,195 171 | 283 25 | 912 146 |
| 2016-17 | 3,973 127 | 2,647 -4 | 946 16 | 1,701 -20 | 1,326 131 | 283 0 | 1,043 131 |
| 2017-18 | 3,757 -216 | 2,544 -103 | 907 -39 | 1,637 -64 | 1,213 -113 | 286 3 | 927 -116 |
| 2018-19 | 3,369 -388 | 2,552 8 | 925 18 | 1,627 -10 | 817 -396 | 257 -29 | 560 -367 |
| 2019-20 | 3,331 -38 | 2,553 1 | 912 -13 | 1,641 14 | 778 -39 | 273 16 | 505 -55 |
| 2020-21 | 3,293 -38 | 2,484 -69 | 909 -3 | 1,575 -66 | 809 31 | 255 -18 | 554 49 |
| 2021-22 | 3,149 -144 | 2,407 -77 | 895 -14 | 1,512 -63 | 742 -67 | 251 -4 | 491 -63 |
| 2022-23 | 2,970 -179 | 2,343 -64 | 899 4 | 1,444 -68 | 627 -115 | 208 -43 | 419 -72 |
| Average | 3,483 | 2,554 | 923 | 1,631 | 930 | 262 | 668 |