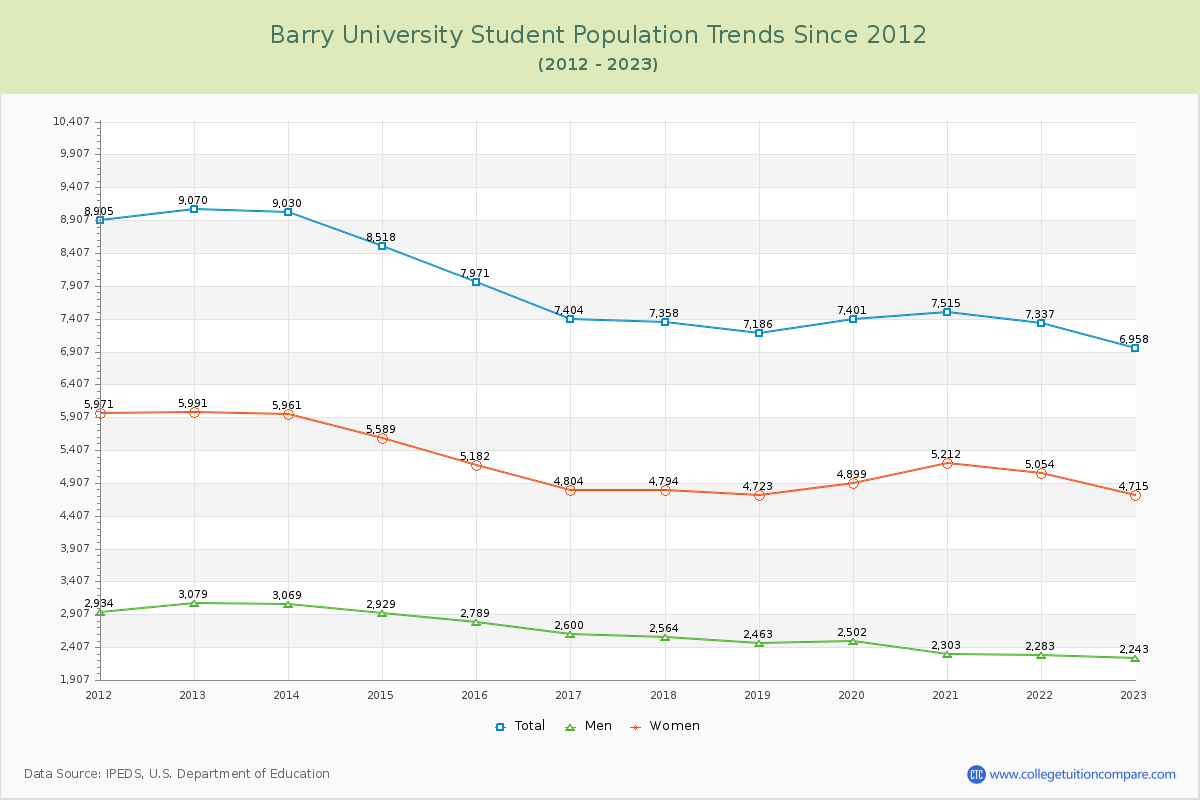
Student Population Changes
The average student population over the last 12 years is 7,795 where 6,958 students are attending the school for the academic year 2022-2023.
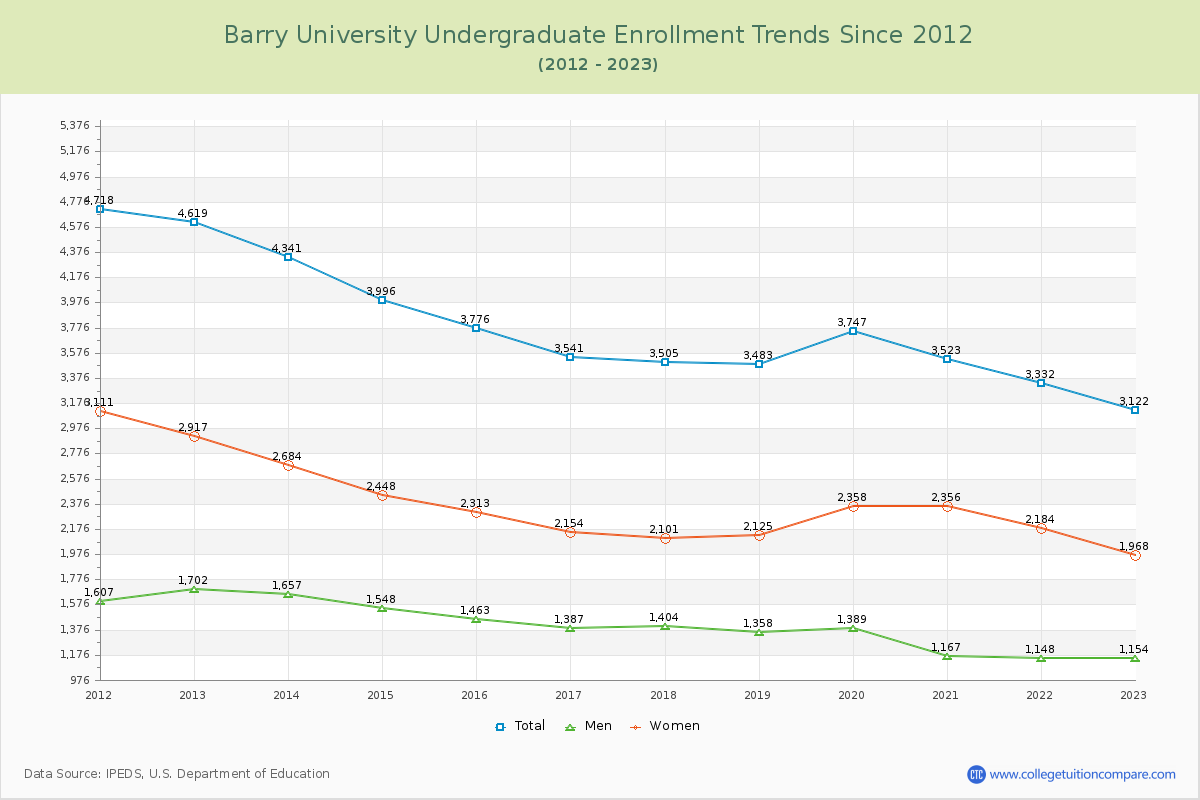
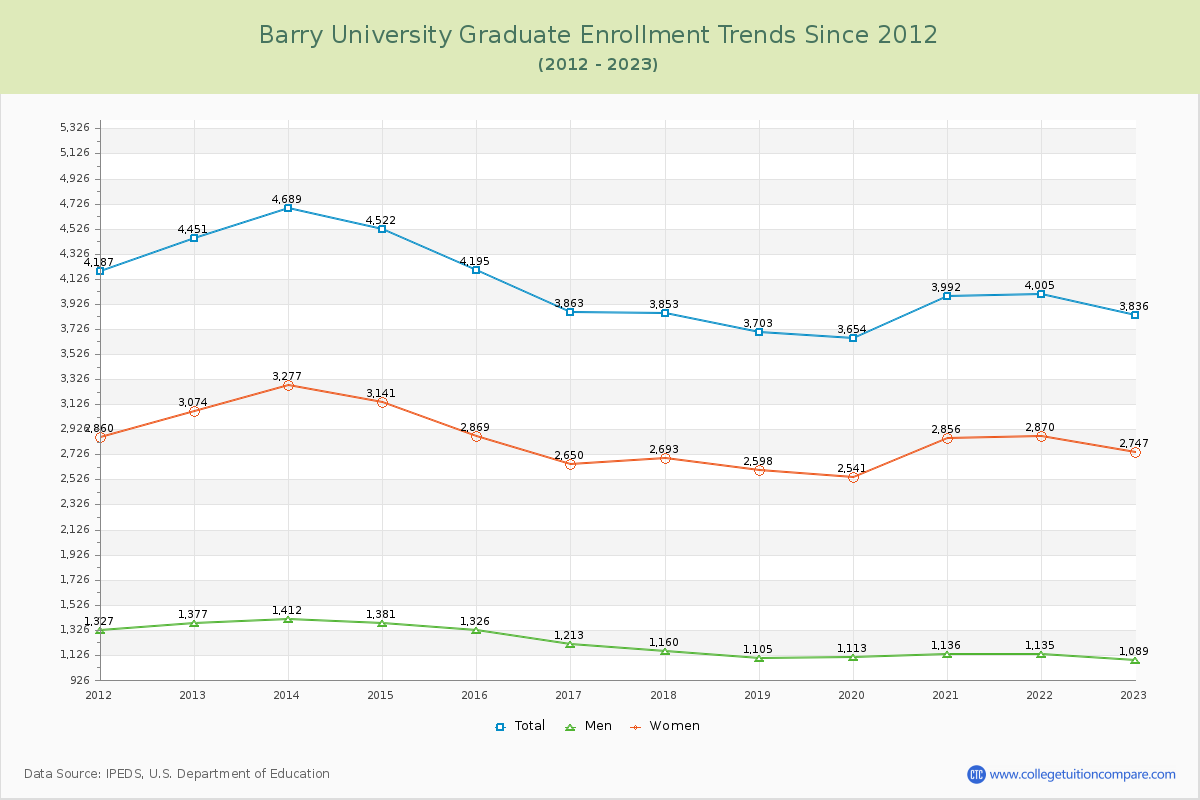
44.87% of total students is undergraduate students and 55.13% students is graduate students. The number of undergraduate students has decreased by 1,497 and the graduate enrollment has decreased by 615 over past 10 years.
The female to male ratio is 2.10 to 1 and it means that there are far more female students enrolled in Barry than male students.
The following table and chart illustrate the changes in student population by gender at Barry University since 2012.
| Year | Total | Undergraduate | Graduate | ||||
|---|---|---|---|---|---|---|---|
| Total | Men | Women | Total | Men | Women | ||
| 2012-13 | 9,070 | 4,619 | 1,702 | 2,917 | 4,451 | 1,377 | 3,074 |
| 2013-14 | 9,030 -40 | 4,341 -278 | 1,657 -45 | 2,684 -233 | 4,689 238 | 1,412 35 | 3,277 203 |
| 2014-15 | 8,518 -512 | 3,996 -345 | 1,548 -109 | 2,448 -236 | 4,522 -167 | 1,381 -31 | 3,141 -136 |
| 2015-16 | 7,971 -547 | 3,776 -220 | 1,463 -85 | 2,313 -135 | 4,195 -327 | 1,326 -55 | 2,869 -272 |
| 2016-17 | 7,404 -567 | 3,541 -235 | 1,387 -76 | 2,154 -159 | 3,863 -332 | 1,213 -113 | 2,650 -219 |
| 2017-18 | 7,358 -46 | 3,505 -36 | 1,404 17 | 2,101 -53 | 3,853 -10 | 1,160 -53 | 2,693 43 |
| 2018-19 | 7,186 -172 | 3,483 -22 | 1,358 -46 | 2,125 24 | 3,703 -150 | 1,105 -55 | 2,598 -95 |
| 2019-20 | 7,401 215 | 3,747 264 | 1,389 31 | 2,358 233 | 3,654 -49 | 1,113 8 | 2,541 -57 |
| 2020-21 | 7,515 114 | 3,523 -224 | 1,167 -222 | 2,356 -2 | 3,992 338 | 1,136 23 | 2,856 315 |
| 2021-22 | 7,337 -178 | 3,332 -191 | 1,148 -19 | 2,184 -172 | 4,005 13 | 1,135 -1 | 2,870 14 |
| 2022-23 | 6,958 -379 | 3,122 -210 | 1,154 6 | 1,968 -216 | 3,836 -169 | 1,089 -46 | 2,747 -123 |
| Average | 7,795 | 3,726 | 1,398 | 2,328 | 4,069 | 1,222 | 2,847 |