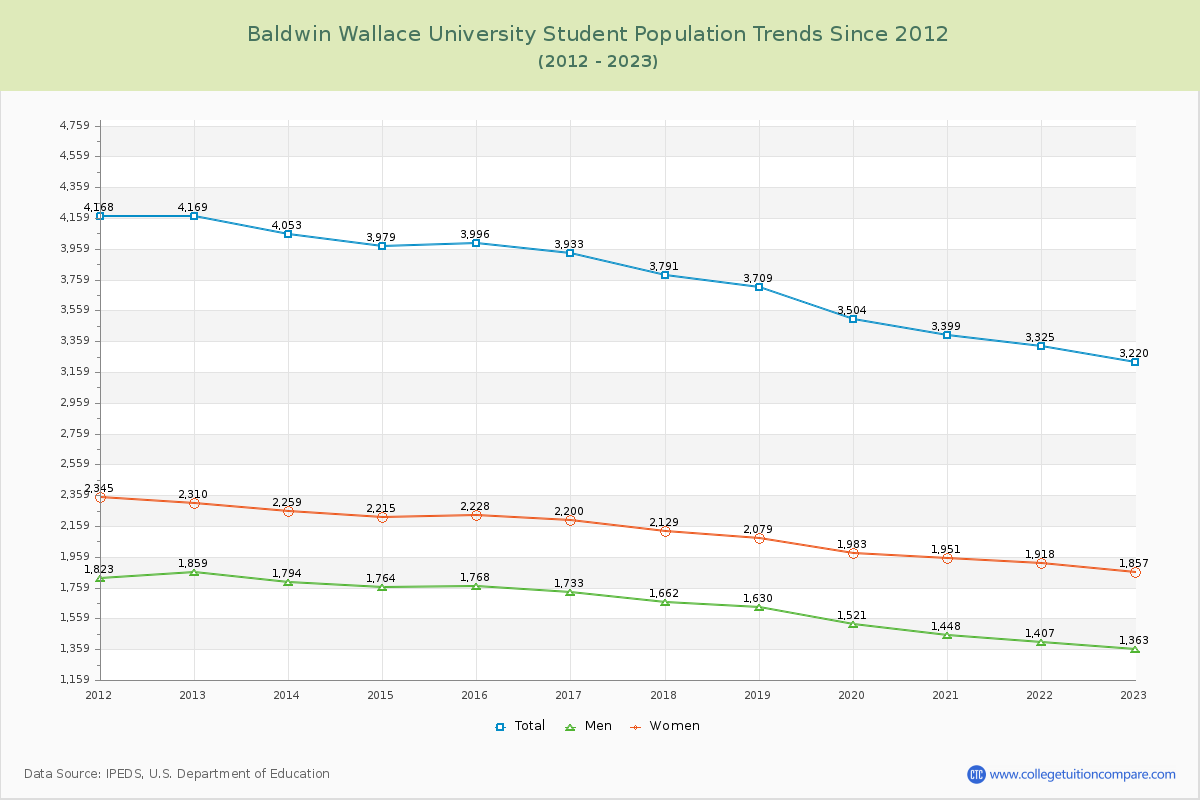
Student Population Changes
The average student population over the last 12 years is 3,734 where 3,220 students are attending the school for the academic year 2022-2023.
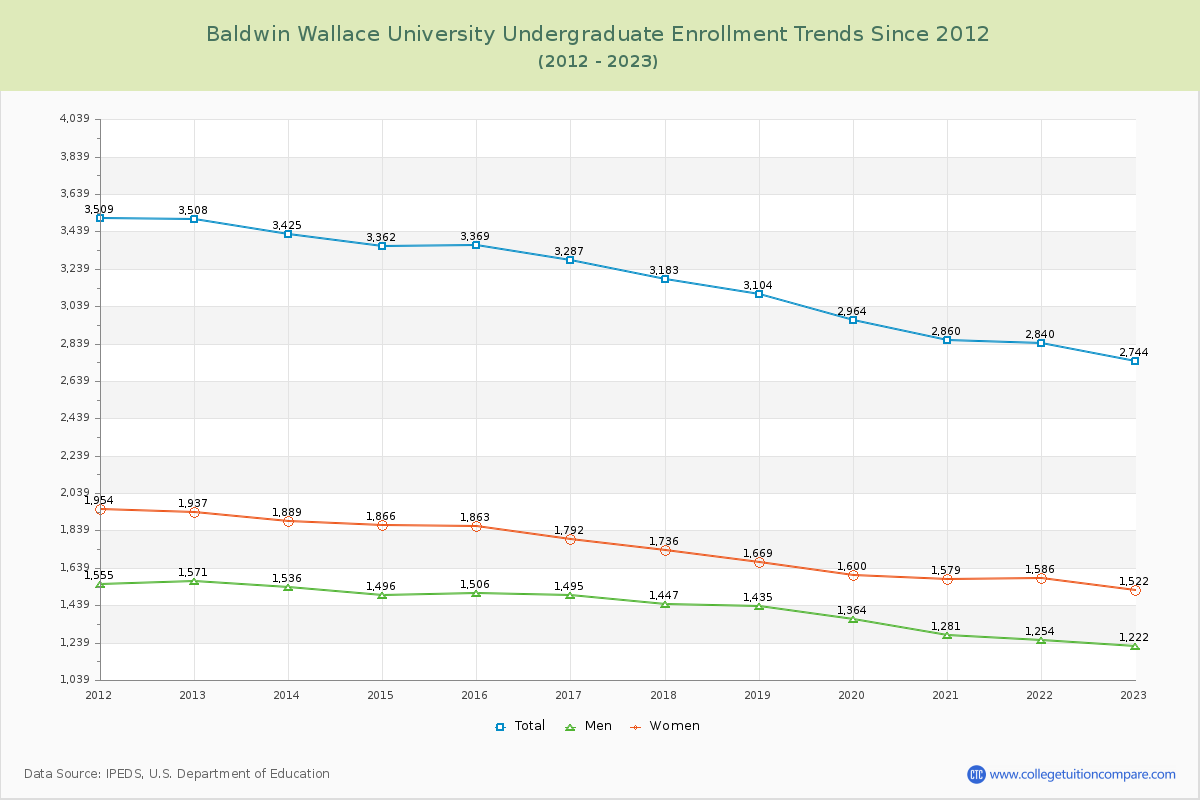
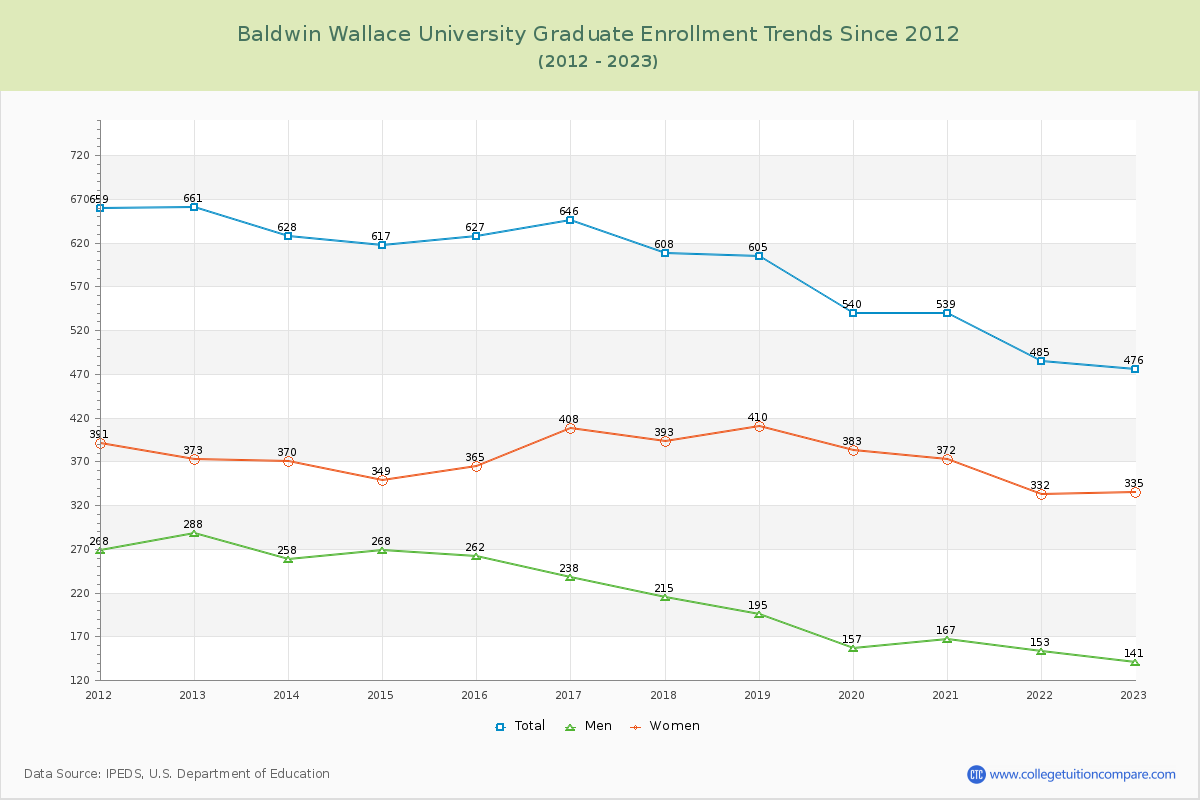
85.22% of total students is undergraduate students and 14.78% students is graduate students. The number of undergraduate students has decreased by 764 and the graduate enrollment has decreased by 185 over past 10 years.
The female to male ratio is 1.36 to 1 and it means that there are more female students enrolled in Baldwin-Wallace than male students.
The following table and chart illustrate the changes in student population by gender at Baldwin Wallace University since 2012.
| Year | Total | Undergraduate | Graduate | ||||
|---|---|---|---|---|---|---|---|
| Total | Men | Women | Total | Men | Women | ||
| 2012-13 | 4,169 | 3,508 | 1,571 | 1,937 | 661 | 288 | 373 |
| 2013-14 | 4,053 -116 | 3,425 -83 | 1,536 -35 | 1,889 -48 | 628 -33 | 258 -30 | 370 -3 |
| 2014-15 | 3,979 -74 | 3,362 -63 | 1,496 -40 | 1,866 -23 | 617 -11 | 268 10 | 349 -21 |
| 2015-16 | 3,996 17 | 3,369 7 | 1,506 10 | 1,863 -3 | 627 10 | 262 -6 | 365 16 |
| 2016-17 | 3,933 -63 | 3,287 -82 | 1,495 -11 | 1,792 -71 | 646 19 | 238 -24 | 408 43 |
| 2017-18 | 3,791 -142 | 3,183 -104 | 1,447 -48 | 1,736 -56 | 608 -38 | 215 -23 | 393 -15 |
| 2018-19 | 3,709 -82 | 3,104 -79 | 1,435 -12 | 1,669 -67 | 605 -3 | 195 -20 | 410 17 |
| 2019-20 | 3,504 -205 | 2,964 -140 | 1,364 -71 | 1,600 -69 | 540 -65 | 157 -38 | 383 -27 |
| 2020-21 | 3,399 -105 | 2,860 -104 | 1,281 -83 | 1,579 -21 | 539 -1 | 167 10 | 372 -11 |
| 2021-22 | 3,325 -74 | 2,840 -20 | 1,254 -27 | 1,586 7 | 485 -54 | 153 -14 | 332 -40 |
| 2022-23 | 3,220 -105 | 2,744 -96 | 1,222 -32 | 1,522 -64 | 476 -9 | 141 -12 | 335 3 |
| Average | 3,734 | 3,150 | 1,419 | 1,731 | 585 | 213 | 372 |