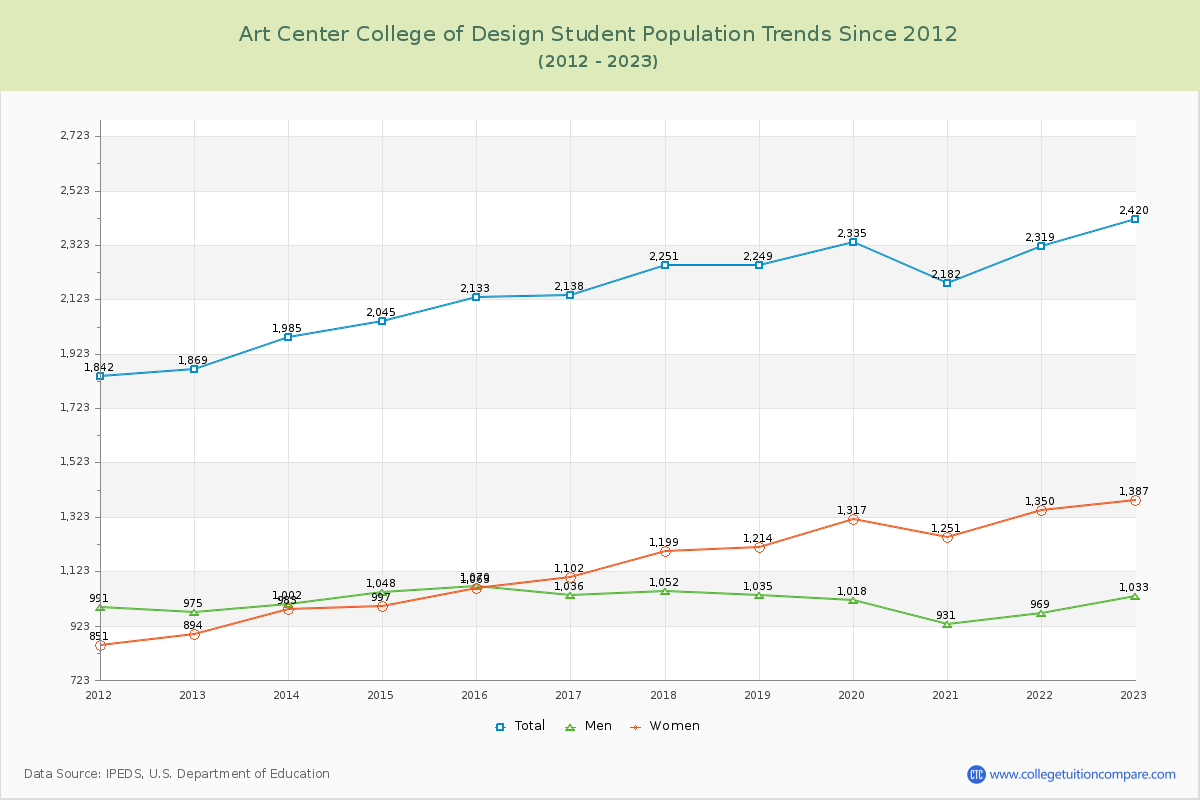
Student Population Changes
The average student population over the last 12 years is 2,175 where 2,420 students are attending the school for the academic year 2022-2023.
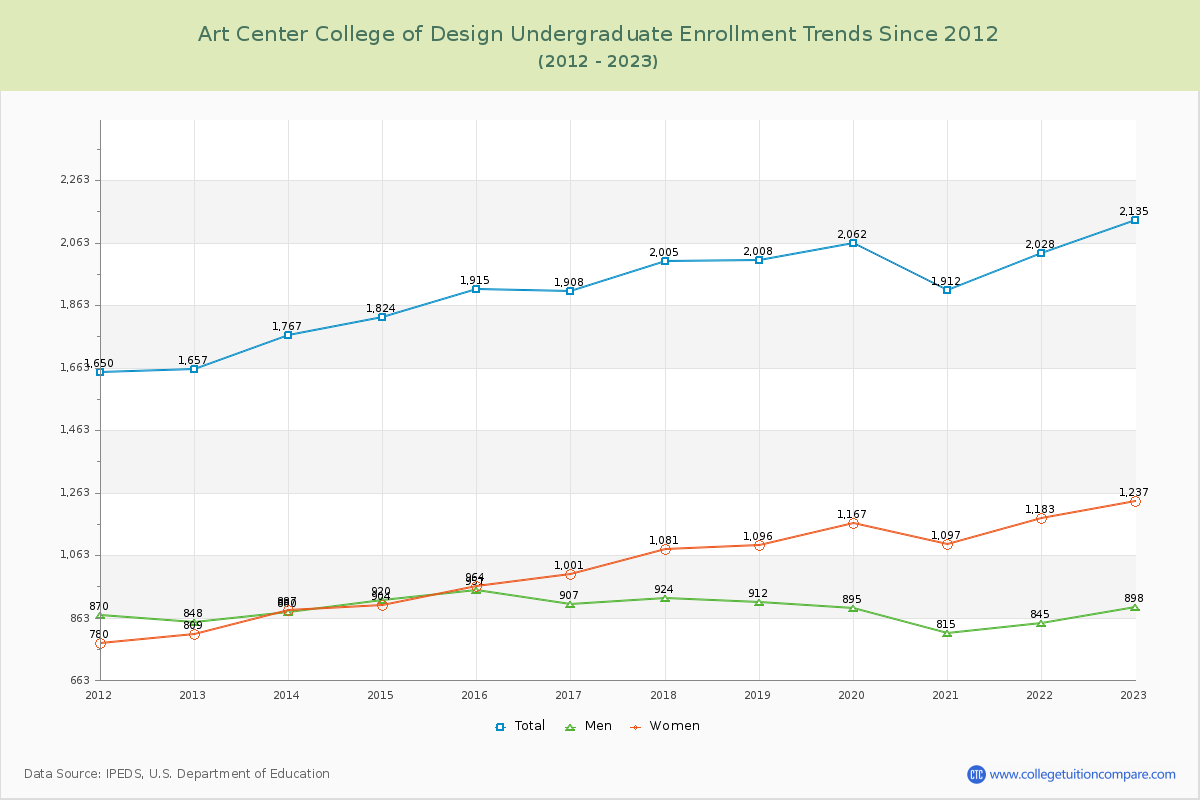
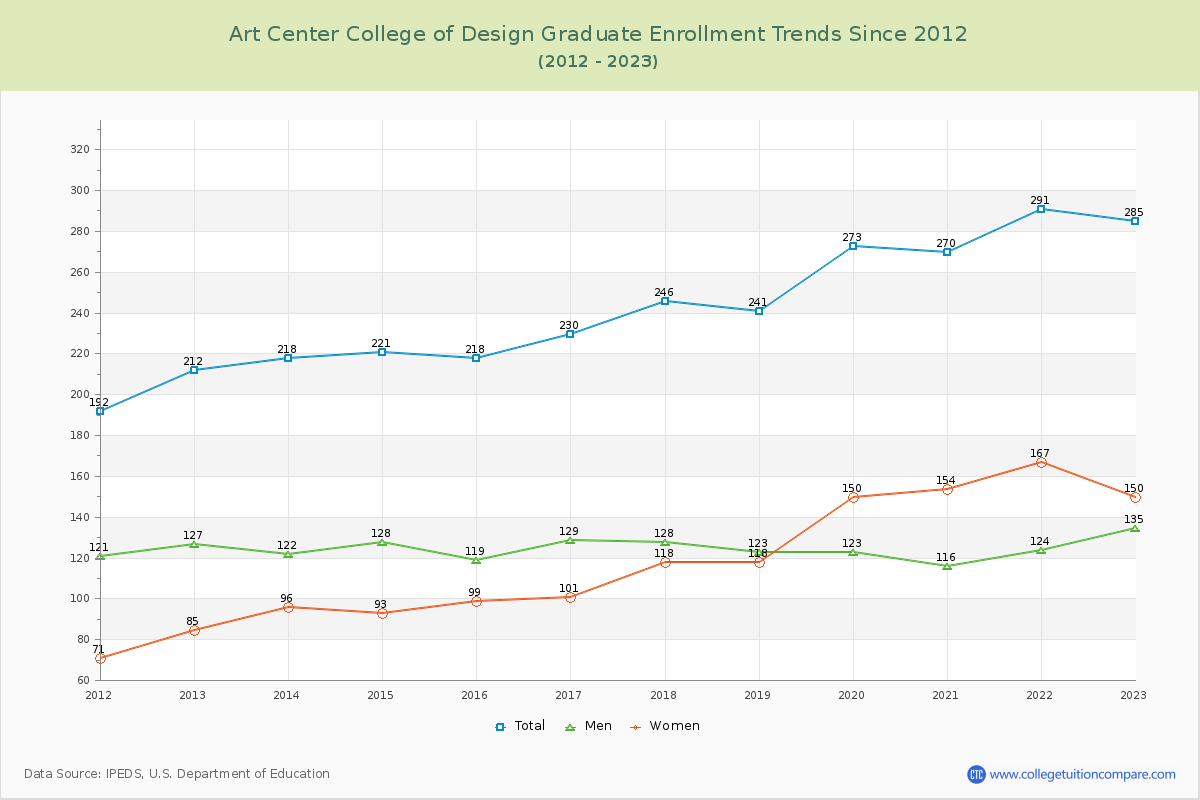
88.22% of total students is undergraduate students and 11.78% students is graduate students. The number of undergraduate students has increased by 478 and the graduate enrollment has increased by 73 over past 10 years.
The female to male ratio is 1.34 to 1 and it means that there are more female students enrolled in Art Center College of Design than male students.
The following table and chart illustrate the changes in student population by gender at Art Center College of Design since 2012.
| Year | Total | Undergraduate | Graduate | ||||
|---|---|---|---|---|---|---|---|
| Total | Men | Women | Total | Men | Women | ||
| 2012-13 | 1,869 | 1,657 | 848 | 809 | 212 | 127 | 85 |
| 2013-14 | 1,985 116 | 1,767 110 | 880 32 | 887 78 | 218 6 | 122 -5 | 96 11 |
| 2014-15 | 2,045 60 | 1,824 57 | 920 40 | 904 17 | 221 3 | 128 6 | 93 -3 |
| 2015-16 | 2,133 88 | 1,915 91 | 951 31 | 964 60 | 218 -3 | 119 -9 | 99 6 |
| 2016-17 | 2,138 5 | 1,908 -7 | 907 -44 | 1,001 37 | 230 12 | 129 10 | 101 2 |
| 2017-18 | 2,251 113 | 2,005 97 | 924 17 | 1,081 80 | 246 16 | 128 -1 | 118 17 |
| 2018-19 | 2,249 -2 | 2,008 3 | 912 -12 | 1,096 15 | 241 -5 | 123 -5 | 118 0 |
| 2019-20 | 2,335 86 | 2,062 54 | 895 -17 | 1,167 71 | 273 32 | 123 0 | 150 32 |
| 2020-21 | 2,182 -153 | 1,912 -150 | 815 -80 | 1,097 -70 | 270 -3 | 116 -7 | 154 4 |
| 2021-22 | 2,319 137 | 2,028 116 | 845 30 | 1,183 86 | 291 21 | 124 8 | 167 13 |
| 2022-23 | 2,420 101 | 2,135 107 | 898 53 | 1,237 54 | 285 -6 | 135 11 | 150 -17 |
| Average | 2,175 | 1,929 | 890 | 1,039 | 246 | 125 | 121 |