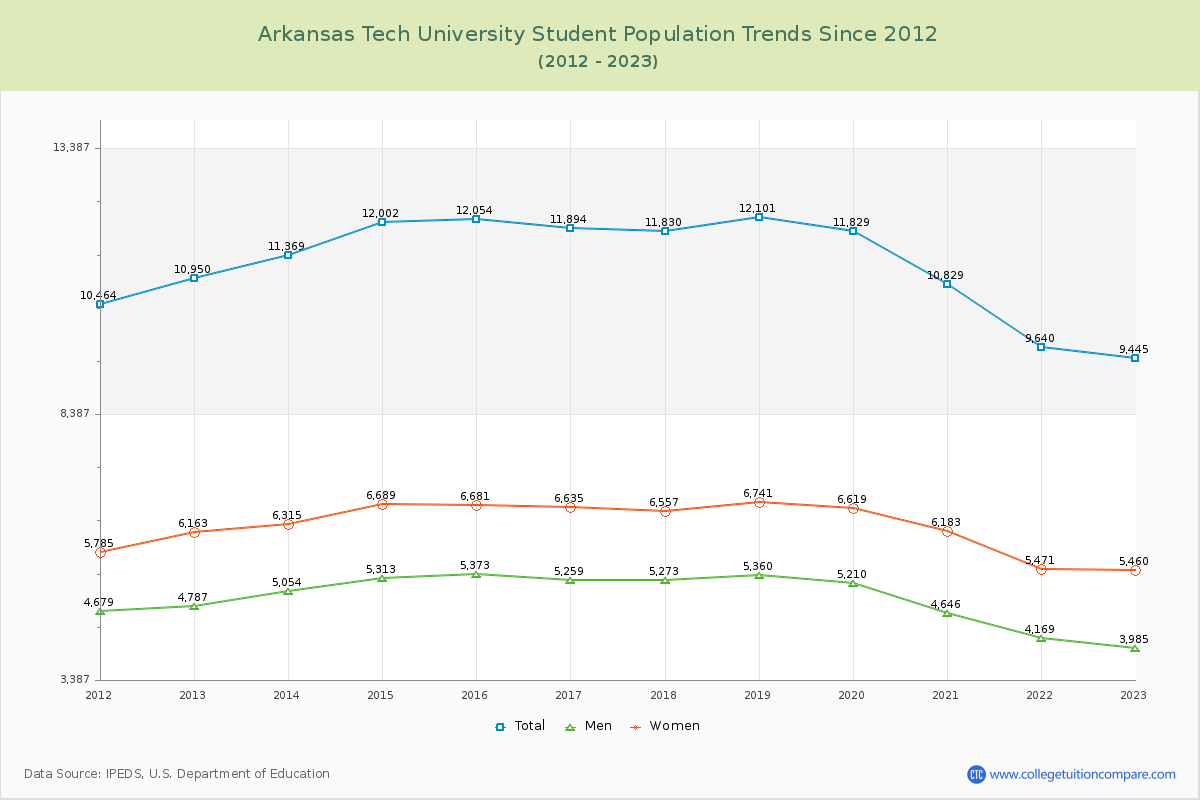
Student Population Changes
The average student population over the last 12 years is 11,268 where 9,445 students are attending the school for the academic year 2022-2023.
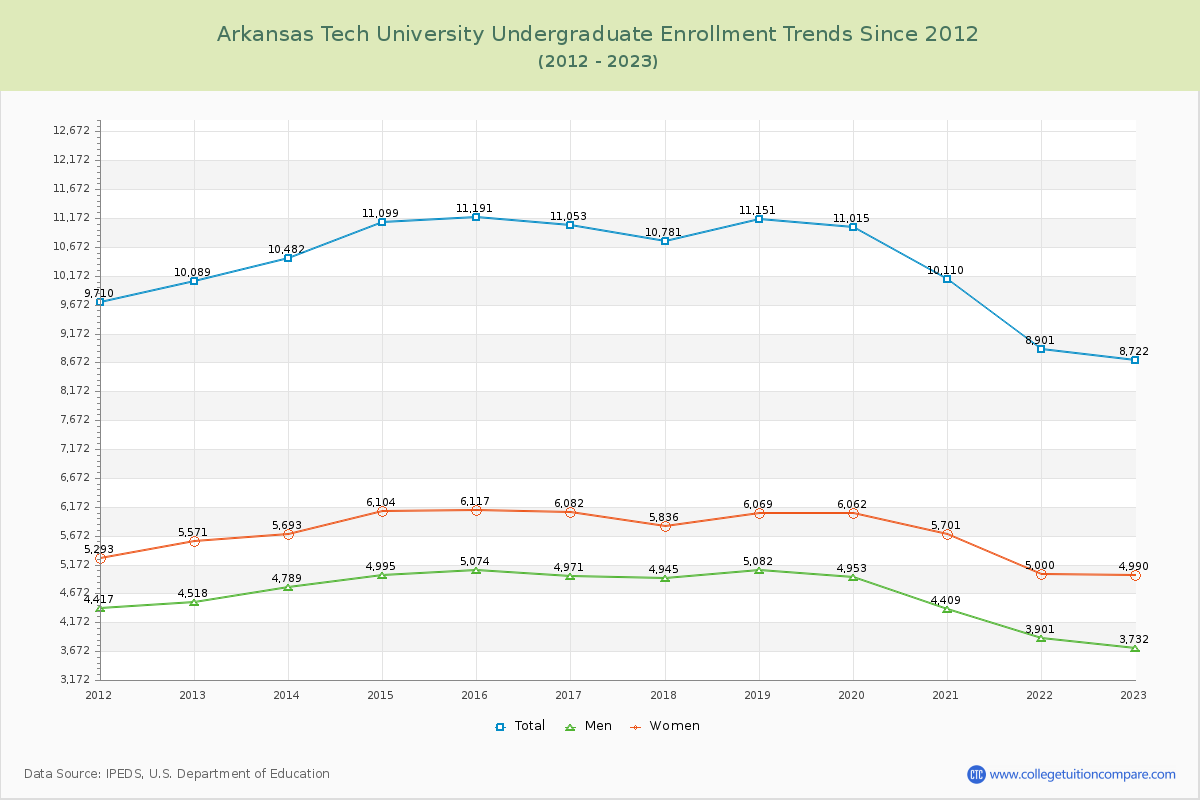
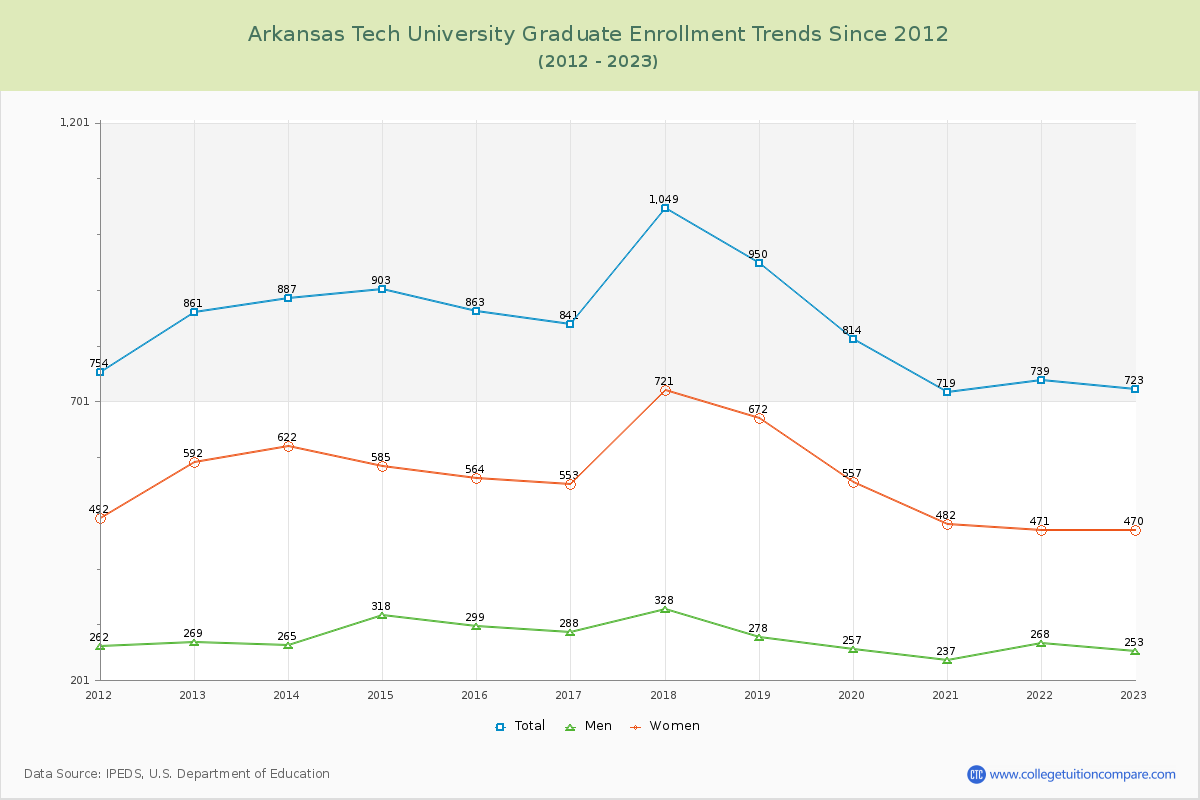
92.35% of total students is undergraduate students and 7.65% students is graduate students. The number of undergraduate students has decreased by 1,367 and the graduate enrollment has decreased by 138 over past 10 years.
The female to male ratio is 1.37 to 1 and it means that there are more female students enrolled in ATU than male students.
The following table and chart illustrate the changes in student population by gender at Arkansas Tech University since 2012.
| Year | Total | Undergraduate | Graduate | ||||
|---|---|---|---|---|---|---|---|
| Total | Men | Women | Total | Men | Women | ||
| 2012-13 | 10,950 | 10,089 | 4,518 | 5,571 | 861 | 269 | 592 |
| 2013-14 | 11,369 419 | 10,482 393 | 4,789 271 | 5,693 122 | 887 26 | 265 -4 | 622 30 |
| 2014-15 | 12,002 633 | 11,099 617 | 4,995 206 | 6,104 411 | 903 16 | 318 53 | 585 -37 |
| 2015-16 | 12,054 52 | 11,191 92 | 5,074 79 | 6,117 13 | 863 -40 | 299 -19 | 564 -21 |
| 2016-17 | 11,894 -160 | 11,053 -138 | 4,971 -103 | 6,082 -35 | 841 -22 | 288 -11 | 553 -11 |
| 2017-18 | 11,830 -64 | 10,781 -272 | 4,945 -26 | 5,836 -246 | 1,049 208 | 328 40 | 721 168 |
| 2018-19 | 12,101 271 | 11,151 370 | 5,082 137 | 6,069 233 | 950 -99 | 278 -50 | 672 -49 |
| 2019-20 | 11,829 -272 | 11,015 -136 | 4,953 -129 | 6,062 -7 | 814 -136 | 257 -21 | 557 -115 |
| 2020-21 | 10,829 -1,000 | 10,110 -905 | 4,409 -544 | 5,701 -361 | 719 -95 | 237 -20 | 482 -75 |
| 2021-22 | 9,640 -1,189 | 8,901 -1,209 | 3,901 -508 | 5,000 -701 | 739 20 | 268 31 | 471 -11 |
| 2022-23 | 9,445 -195 | 8,722 -179 | 3,732 -169 | 4,990 -10 | 723 -16 | 253 -15 | 470 -1 |
| Average | 11,268 | 10,418 | 4,670 | 5,748 | 850 | 278 | 572 |