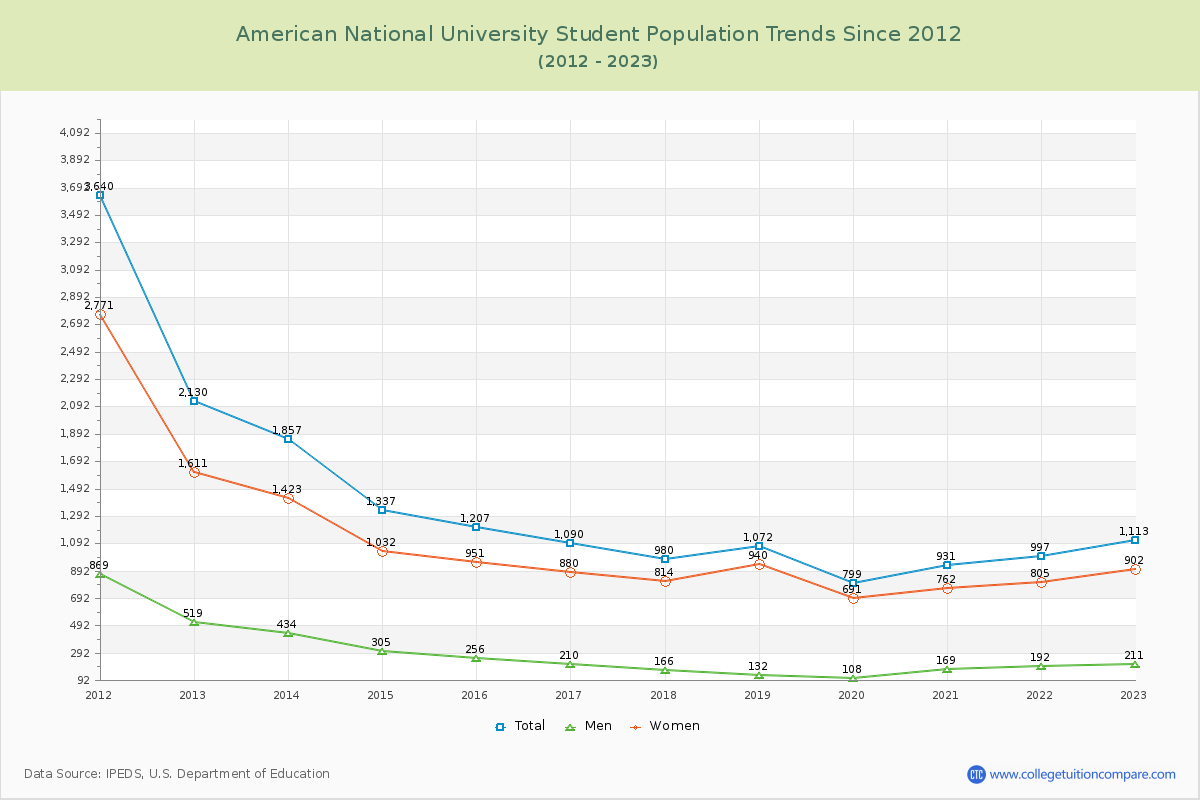
Student Population Changes
The average student population over the last 12 years is 1,228 where 1,113 students are attending the school for the academic year 2022-2023.
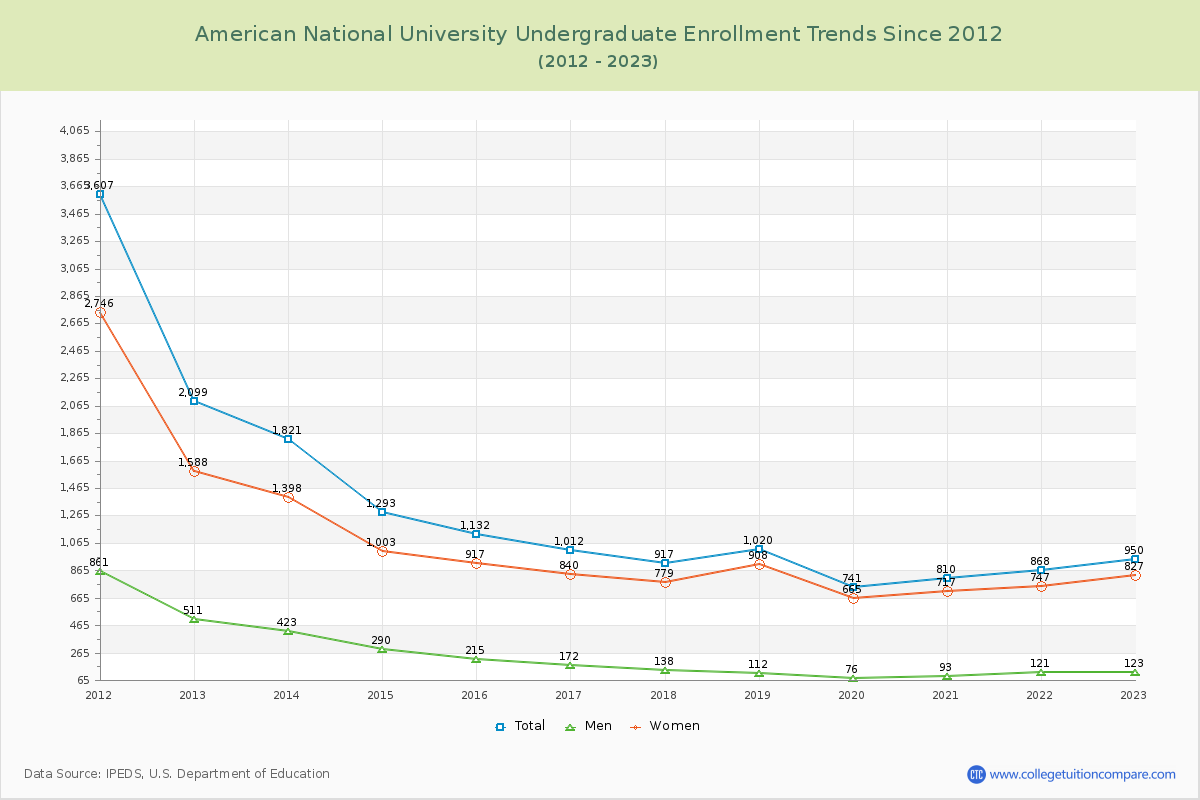
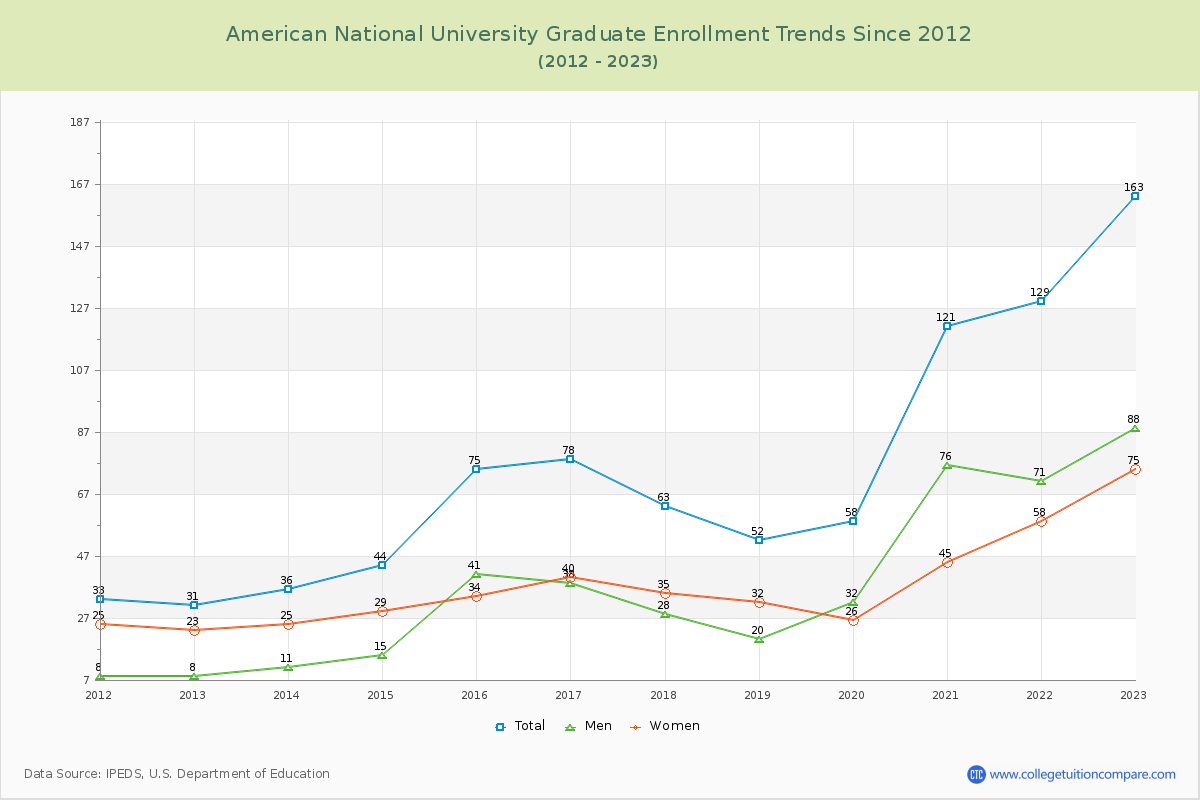
85.35% of total students is undergraduate students and 14.65% students is graduate students. The number of undergraduate students has decreased by 1,149 and the graduate enrollment has increased by 132 over past 10 years.
The female to male ratio is 4.27 to 1 and it means that there are far more female students enrolled in American National than male students.
The following table and chart illustrate the changes in student population by gender at American National University since 2012.
| Year | Total | Undergraduate | Graduate | ||||
|---|---|---|---|---|---|---|---|
| Total | Men | Women | Total | Men | Women | ||
| 2012-13 | 2,130 | 2,099 | 511 | 1,588 | 31 | 8 | 23 |
| 2013-14 | 1,857 -273 | 1,821 -278 | 423 -88 | 1,398 -190 | 36 5 | 11 3 | 25 2 |
| 2014-15 | 1,337 -520 | 1,293 -528 | 290 -133 | 1,003 -395 | 44 8 | 15 4 | 29 4 |
| 2015-16 | 1,207 -130 | 1,132 -161 | 215 -75 | 917 -86 | 75 31 | 41 26 | 34 5 |
| 2016-17 | 1,090 -117 | 1,012 -120 | 172 -43 | 840 -77 | 78 3 | 38 -3 | 40 6 |
| 2017-18 | 980 -110 | 917 -95 | 138 -34 | 779 -61 | 63 -15 | 28 -10 | 35 -5 |
| 2018-19 | 1,072 92 | 1,020 103 | 112 -26 | 908 129 | 52 -11 | 20 -8 | 32 -3 |
| 2019-20 | 799 -273 | 741 -279 | 76 -36 | 665 -243 | 58 6 | 32 12 | 26 -6 |
| 2020-21 | 931 132 | 810 69 | 93 17 | 717 52 | 121 63 | 76 44 | 45 19 |
| 2021-22 | 997 66 | 868 58 | 121 28 | 747 30 | 129 8 | 71 -5 | 58 13 |
| 2022-23 | 1,113 116 | 950 82 | 123 2 | 827 80 | 163 34 | 88 17 | 75 17 |
| Average | 1,228 | 1,151 | 207 | 944 | 77 | 39 | 38 |