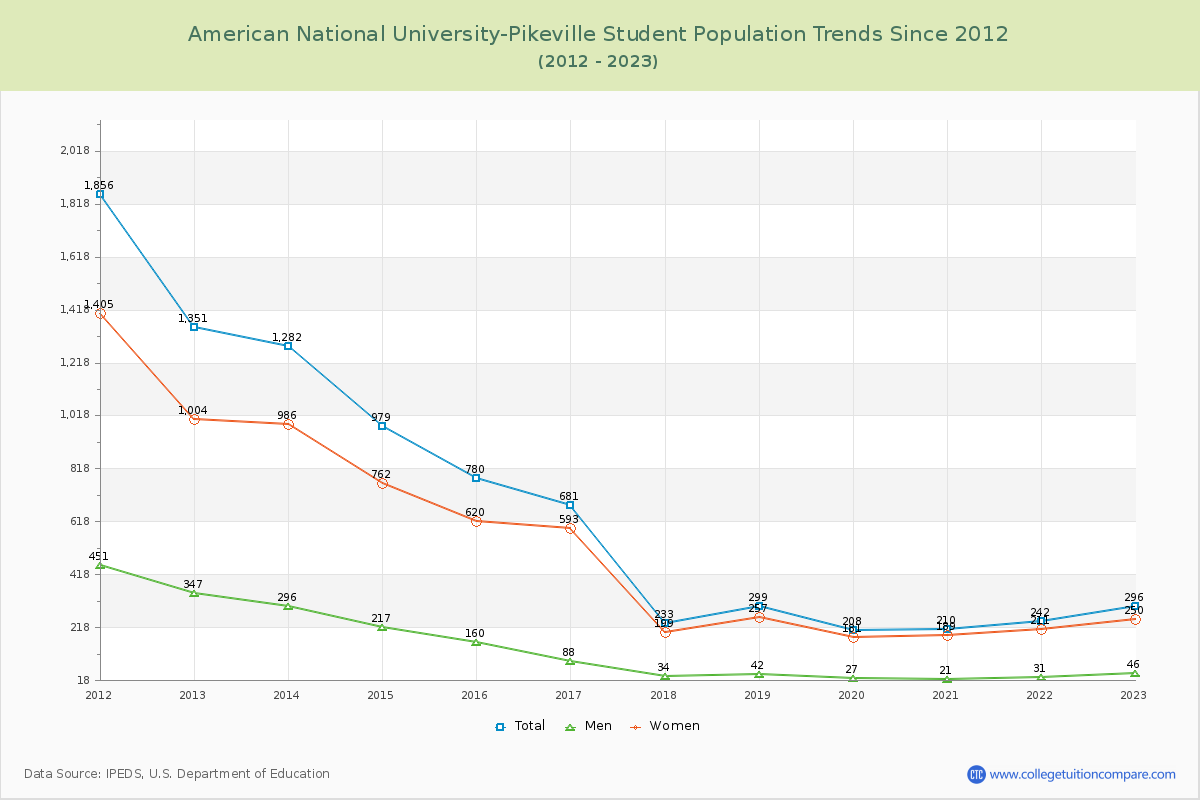
Student Population Changes
The average student population over the last 12 years is 596 where 296 students are attending the school for the academic year 2022-2023.
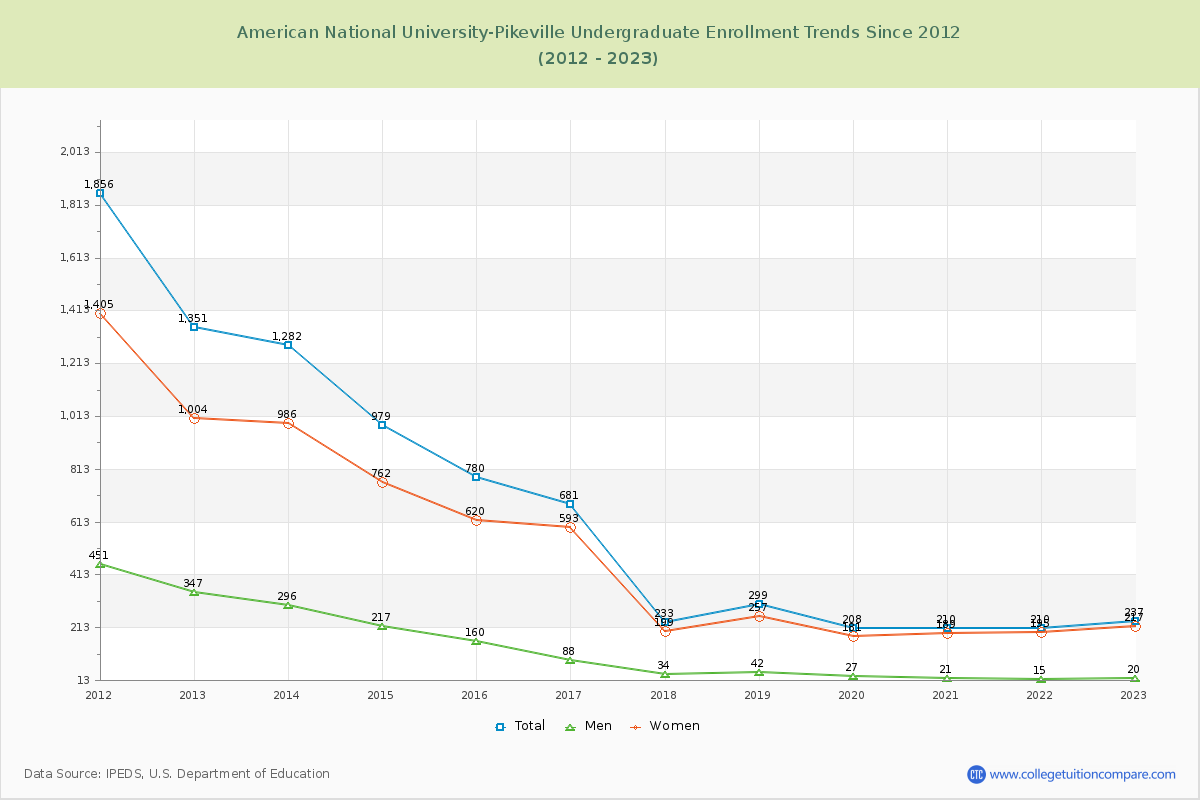
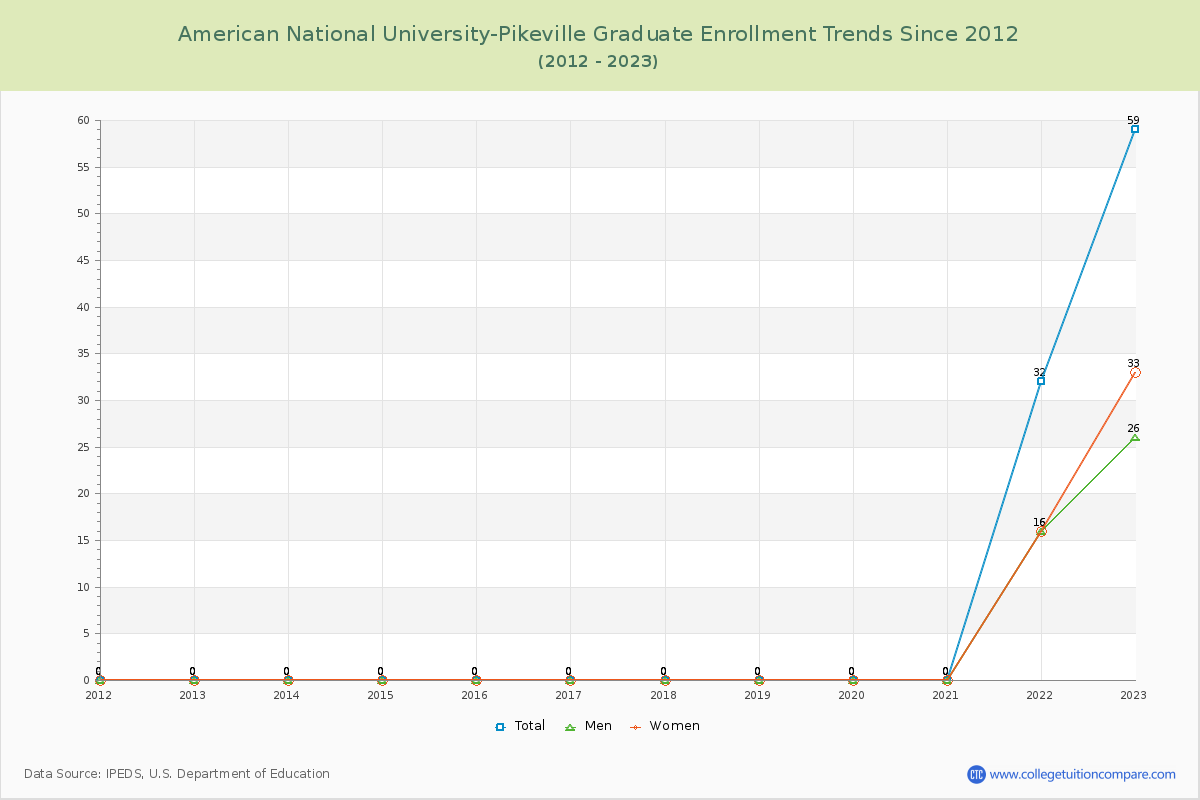
80.07% of total students is undergraduate students and 19.93% students is graduate students. The number of undergraduate students has decreased by 1,114 and the graduate enrollment has increased by 59 over past 10 years.
The female to male ratio is 5.43 to 1 and it means that there are far more female students enrolled in American National University-Pikeville than male students.
The following table and chart illustrate the changes in student population by gender at American National University-Pikeville since 2012.
| Year | Total | Undergraduate | Graduate | ||||
|---|---|---|---|---|---|---|---|
| Total | Men | Women | Total | Men | Women | ||
| 2012-13 | 1,351 | 1,351 | 347 | 1,004 | 0 | 0 | 0 |
| 2013-14 | 1,282 -69 | 1,282 -69 | 296 -51 | 986 -18 | 0 0 | 0 0 | 0 0 |
| 2014-15 | 979 -303 | 979 -303 | 217 -79 | 762 -224 | 0 0 | 0 0 | 0 0 |
| 2015-16 | 780 -199 | 780 -199 | 160 -57 | 620 -142 | 0 0 | 0 0 | 0 0 |
| 2016-17 | 681 -99 | 681 -99 | 88 -72 | 593 -27 | 0 0 | 0 0 | 0 0 |
| 2017-18 | 233 -448 | 233 -448 | 34 -54 | 199 -394 | 0 0 | 0 0 | 0 0 |
| 2018-19 | 299 66 | 299 66 | 42 8 | 257 58 | 0 0 | 0 0 | 0 0 |
| 2019-20 | 208 -91 | 208 -91 | 27 -15 | 181 -76 | 0 0 | 0 0 | 0 0 |
| 2020-21 | 210 2 | 210 2 | 21 -6 | 189 8 | 0 0 | 0 0 | 0 0 |
| 2021-22 | 242 32 | 210 0 | 15 -6 | 195 6 | 32 32 | 16 16 | 16 16 |
| 2022-23 | 296 54 | 237 27 | 20 5 | 217 22 | 59 27 | 26 10 | 33 17 |
| Average | 596 | 588 | 115 | 473 | 8 | 4 | 4 |